Figure 5.
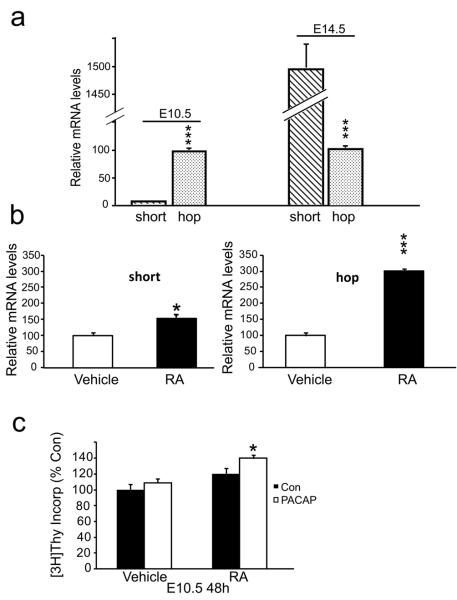
Developmental transition of PAC1 receptor mRNA isoform expression during corticogenesis and regulation by retinoic acid. (a) At E10.5, the level of the hop isoform is 24-fold greater than short; at E14.5, short is 15-fold greater than hop. Values are presented as fold difference when compared with the E10.5 hop mRNA levels arbitrarily set at 100. Values are representative of three experiments, three to eight animals per group for each experiment. ***P<0.001. (b) RA exposure increased differentially the short and hop isoforms at 24 h, detected using real time PCR. Data represent three experiments, two dishes per group, N=6 (2 × 10⁶ cells/dish) for RNA quantification. (c) E10.5 precursors were incubated with either vehicle (ethanol) or RA (30 nM) at plating. At 24 h, cultures received either PACAP vehicle (Con) or PACAP (10 nM) and DNA synthesis was assessed at 48 h. In the presence of RA, PACAP increased precursor DNA synthesis, while the peptide had no effect in the RA vehicle group. Note that RA alone had no effect on DNA synthesis.; Data represent 3 wells per group (25,000 cells/well) in each of 3 experiments for [3H] thymidine incorporation. *P<0.05, ***P<0.001.

