Figure 8.
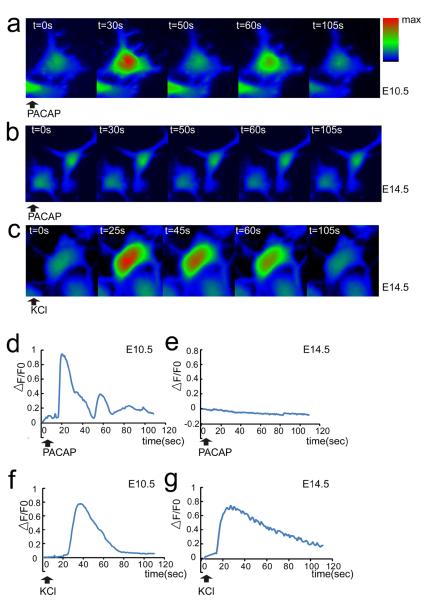
PACAP induces intracellular Ca2+ fluxes in E10.5 but not E14.5 cortical precursors. (a–c) Representative color-coded images of intracellular Ca2+ fluxes. Cells were pre-loaded with Ca2+ fluorescent indicator Fluo-4 AM and recorded for 110 s after reagent addition. (d–g) Representative traces of intracellular [Ca2+] changes, which are reflected by △F/F0, △F=F-F0; F0 is fluorescence intensity before addition of reagents. PACAP (10 nM) exposure increased intracellular calcium levels in E10.5 (a, d) but not E14.5 precursors (b, e) at 2 h culture. KCl (40 mM) elicited increased intracellular Ca2+ in both E10.5 (f) and E14.5 (c, g). Cells were monitored by BD Pathway 855 BioImager, at 37°C/5% CO2. Data were derived from three independent experiments using parallel cultures of E10.5 and E14.5 precursors in 96 well plates. 100–150 cells per group were randomly chosen in each experiment and fluorescence intensity values were quantified.

