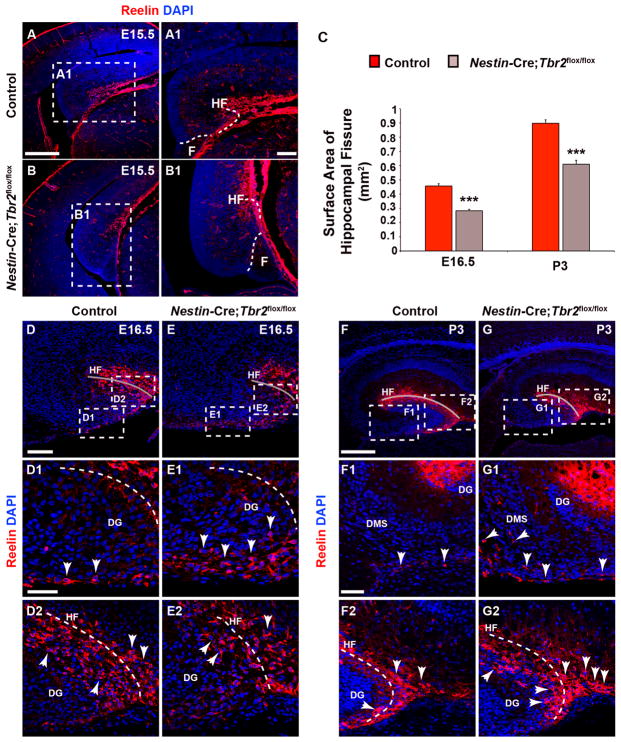
Figure 3. Rotation of the hippocampus and formation of the hippocampal fissure are abnormal in Nestin-Cre;Tbr2flox/flox mice.
(A-A1) In control mice, invagination of the pial surface to form the hippocampal fissure (HF) occurs concurrent with rotation of the developing hippocampus. (B-B1) In Nestin-Cre;Tbr2flox/flox mice, rotation of the hippocampus is impaired, such that the DG appears to be rotated 90° in mutant mice in comparison to controls (compare A and B). (B-B1) As well, invagination of the pial surface is delayed in mutant mice, resulting in a reduction in the size of the HF. (C) Consistent with delayed invagination of the pial surface in Nestin-Cre;Tbr2flox/flox mice, the surface area of the HF is persistently and significantly reduced in mutant mice (ANOVA, N=3, P<0.001). Graphs in (C) represent the mean ±SEM (**P<0.01, ***P<0.001). (D-D2) By E16.5, the majority of Reelin+ Cajal-Retzius cells are localized to the HF (grey line) in control mice (D2), and a smaller population of these cells can be seen in the dentate migratory stream (DMS). (E-E2) In contrast, the DMS is rich in Reelin+ Cajal-Retzius cells in Nestin-Cre;Tbr2flox/flox mice and there are fewer of these cells located in the HF in mutant mice, suggesting impaired migration and ectopic localization of these cells in mutants. The reduction in HF surface area is also evident in mutant mice (compare grey lines in D, E and compare D2 and E2). (F-F2) By P3, very few Reelin+ Cajal-Retzius cells remain in the DMS in control mice (arrows), and the bulk of these cells are located in the HF (F2), which has increased in surface area with continued growth of the DG in comparison to controls at E16.5. (G-G2) However, in Nestin-Cre;Tbr2flox/flox mice ectopic Reelin+ cells can been seen in the DMS (G1, arrows) at P3, suggesting impaired migration of these cells to the HF. (G2) In mutant mice, there is also an increased concentration of Reelin+ cells at the tip of the DG arrows in comparison to controls (F, F2), further supporting ectopic localization of Cajal-Retzius cells in Nestin-Cre;Tbr2flox/flox mice. Scale bars: A = 200 μm, A1 = 50μm, D = 175 μm, D1 = 50 μm, F = 175 μm, F1 = 75 μm. Regions delineated by dashed white boxes are shown in higher magnification in their respective adjacent panels. Grey lines in D-G highlight the HF in each panel.

