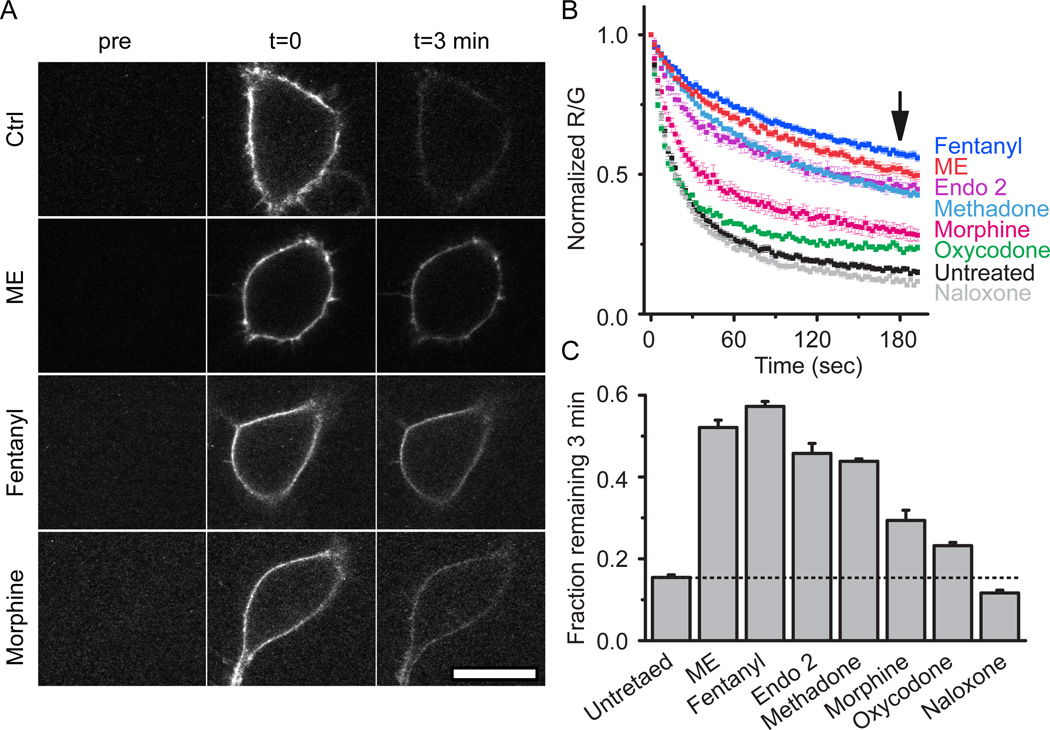
Figure 5. Ligand dependence of receptor modulation.
A, Images taken either before (pre), immediately after (t=0), or 3 minutes after (t=3 min) application and rapid washout of derm A594 (100 nM, 90 sec). Images show derm A594 bound to the plasma membrane of cells expressing FLAG-MOR that were either untreated (ctrl), or treated with ME, fentanyl or morphine for 2 hrs. Scale = 20 µM. B, Quantification of unbinding of derm A594 as shown in “A” following 2 hr pre-treatment with the indicated opioid ligands. Images were taken every 2.5 sec imaging both M1 488 and derm A594. Averaged, normalized ratiometric intensity is plotted. Average±sem, n= 6–9. Arrow shows time=3 min after washout C, Fraction of derm A594 remaining at t=3 min relative to t=0 from data shown in “B” average±sem. All treatments except naloxone resulted in a significant change in the fraction bound after 3 min P <0.05, ANOVA, Tukey post hoc.

