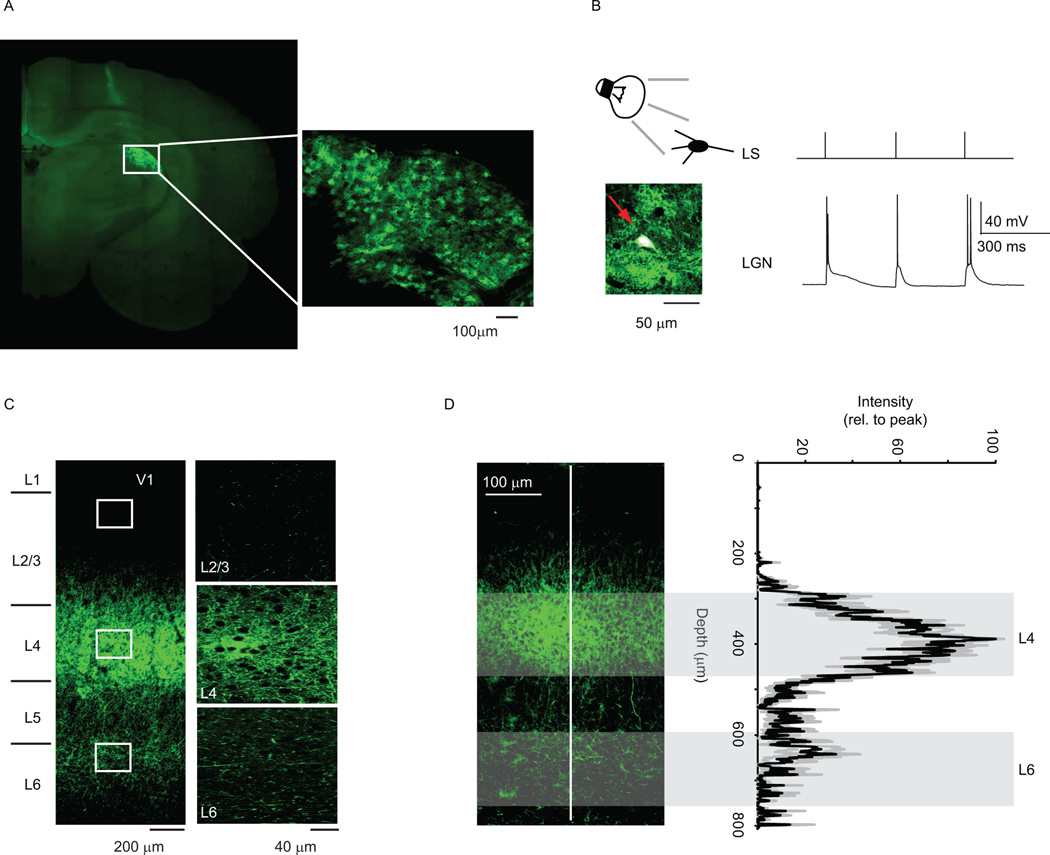
Figure 1. Optogenetic approach to the study of TC synapses from the LGN onto V1.
A. Example of injection of ChR2-GFP in the LGN. The injection was performed on P14 rats and the image was obtained at P28. Top right: expanded image of the injection site. B. Diagram of experimental configuration and image of LGN recorded neuron (white cell stained with biocytin/Alexa647, see arrow). LS, light stimulation was delivered using 3 pulses of 1ms. LGN: sample trace of LGN neuron activity in response to light stimulation. Note that light stimulation effectively activates LGN neurons above threshold. C. Image of LGN terminal fields in acute coronal slices containing V1. The white squares indicate regions of interest that were expanded in the images on the left. D. ChR2 expression in LGN axonal fields is reliable across slices and preparations. Left: sample image of a coronal slice used for patch clamp recordings. Right. Average (black) and standard deviation (grey) of profile of the intensity of the fluorescence signal measured in the region of interest (ROI) indicated by the white line in the left image. Width of ROI: 20 µm. The average plot results from the average of measurements across all recorded slices in which neurons fit our criteria for inclusion in the data analysis. The depth axis is aligned in the plot and in the image. The shaded areas indicate the depth at which recordings in L4 and L6 were performed. Note that the low variability of the level of expression of our construct across preparations.

