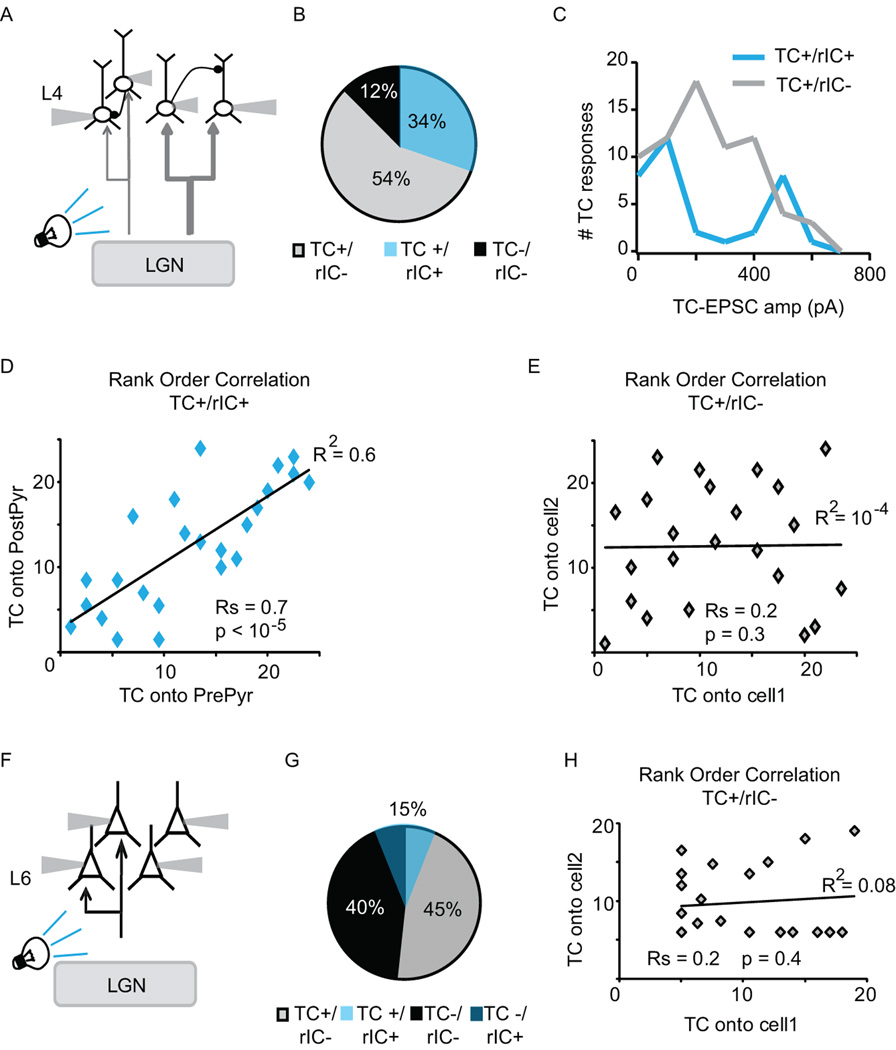
Figure 4. Layer specific organization of TC circuits.
A. Diagram of recording configuration. Light pulses activate LGN terminal fields in V1. Simultaneous patch clamp recordings are obtained from visually identified star pyramids in L4. Stimulation and recordings are within an area of interest of 100 µm × 100 µm. Light intensity was set at 0.3mW/mm2. B. Pie chart indicating proportion of star pyramids not responsive to light stimulation of TC afferents and not recurrently connected in L4 (black, TC−/rIC−); of neurons responding to light stimulation of TC afferents, but not recurrently connected (grey, TC+/rIC−) and of neurons responding to light stimulation of TC afferents and also recurrently connected (blue, TC+/rIC+). C. Distribution of the amplitude of light evoked TC responses for the population of neurons that are not recurrently connected (grey) and for the population of neurons that is recurrently connected within L4 (blue). Note the bimodal distribution of the population of TC/rIC connected neurons. D. Rank order correlation of the TC-EPSC onto the presynaptic neurons versus that onto the postsynaptic neuron on TC+/rIC+ neurons. Rs: Spearman rank-order correlation coefficient; p value of the Spearman correlation, p lower than 0.05 are considered to be significant. E. Rank order correlation of the TC-EPSC onto nearby neuron that are not recurrently connected. Note that all neurons were recorded within a 100 µm × 100 µm area of interest in L4 and often rIC− neurons were recorded in the same quadruplet with rIC+ ones. Rs: Spearman rank-order correlation coefficient; p value of the Spearman correlation. F. Diagram of recording configuration for L6. Light pulses activate the LGN terminal fields in V1, while multiple patch clamp recordings are obtained from pyramidal neurons in L6 within a 100 µm × 100 µm area of interest. Light intensity: 0.3mW/mm2. G. Pie chart indicating the proportion of neurons not responding to light activation of TC axons (black, TC−/rIC−), of neurons not responding to TC activation but recurrently connected (dark blue, TC-/rIC+); of neurons responsive to TC activation but not recurrently connected (grey, TC+/rIC−) and of neurons responsive to TC activation and recurrently connected in L6 (light blue, TC+/rIC+). H. Rank order correlation of TC-EPSC amplitude onto TC+/rIC− neurons. Rs: Spearman rank-order correlation coefficient; p value of the Spearman correlation.

