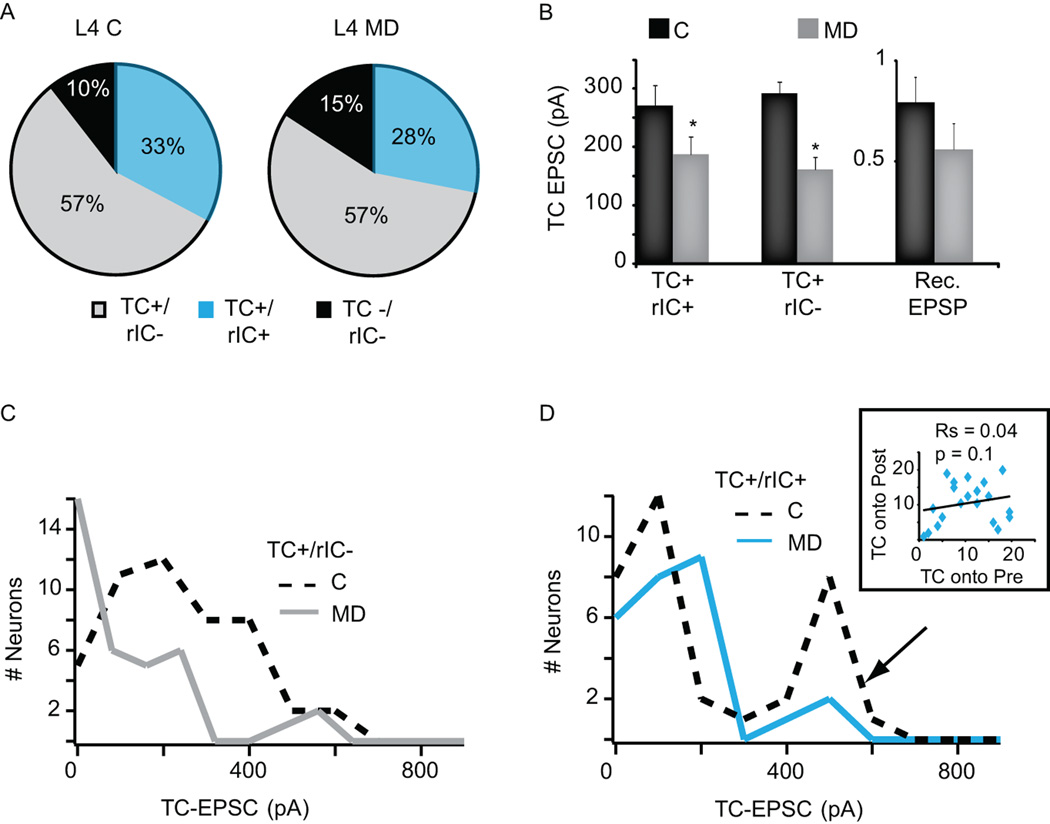
Figure 7. Experience-dependent reorganization of TC/IC inputs onto L4 star pyramids.
A. Pie charts of the proportion of L4 star pyramids not responsive to activation of TC afferents and not recurrently connected (black, TC−/rIC−), of L4 star pyramids responsive to activation of TC afferents and not recurrently connected (grey, TC+/rIC−) and of recurrently connected L4 star pyramids that responded to light activation of TC afferents (light blue, TC+/rIC+). Left chart: control hemisphere (C); right chart: deprived hemisphere (MD). B. Bar plot of average amplitude of TC-EPSC onto TC+/rIC+ L4 star pyramids, of TC-EPSCs onto TC+/rIC− star pyramids and of rIC-EPSP between L4 star pyramids. Light intensity: 0.3mW/mm2. Control: black; deprived: grey. Data are represented as average ± standard error; asterisks indicate significant differences. C. Distribution of TC-EPSC amplitudes onto TC+/rIC− L4 star pyramids. Control: dashed black line; deprived: grey line. Note that the entire distribution is shifted toward smaller amplitudes. D. Distribution of TC-EPSC amplitudes onto TC+/rIC+ star pyramids in L4. Control: dashed black line; deprived: light blue line. Arrow: peak of the distribution strongly affected by MD. Inset: Spearman rank order correlation of TC-EPSP amplitudes onto presynaptic (Pre) and postsynaptic (Post) neurons of TC+/rIC+ L4 star pyramids. Note the MD-induced loss of correlation compared to control conditions (see Figure 4d). Rs: Spearman rank-order correlation coefficient; p value of the Spearman correlation.

