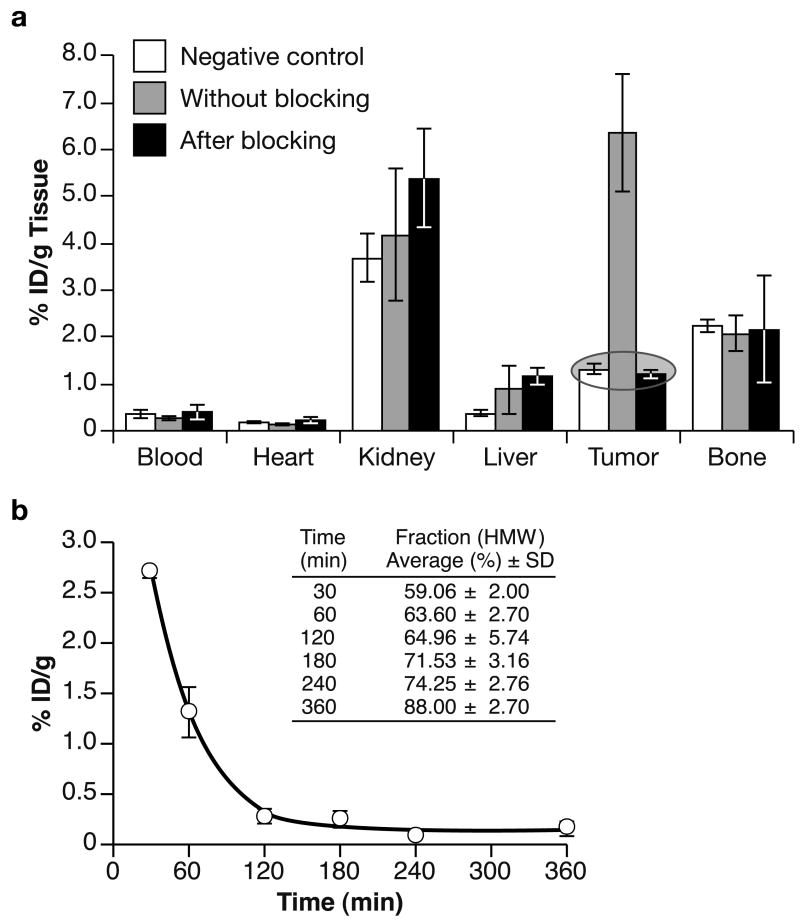
Fig. 4.
A. The [18F]FBEM-ZHER2:432-Affibody uptake 2 h post i.v. injection in athymic nude mice bearing either HER2-positive SKOV-3 cells following pretreatment with or without non-radioactive Affibody, or HER2-negative U251 tumors (tissue type versus %ID/g tissue). Each bar represents an average ± SD from n = 3–6. B. Blood kinetics of [18F]FBEM-ZHER2:342-Affibody. The squares represent %ID/g in the blood with an exponential curve fit. The insert: Average HMW fractions of the plasma-associated radioactivity. Each point represents Mean ± SD (3–4 mice).

