
Figure 6.
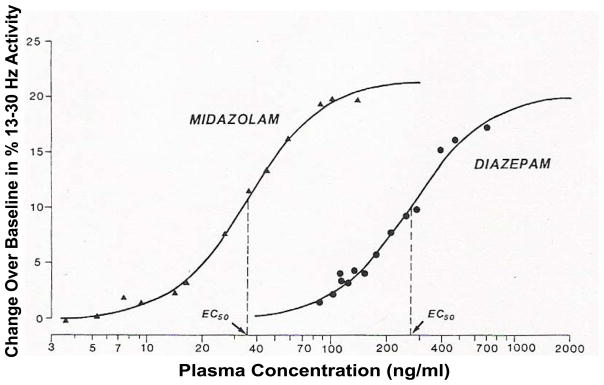
Relationship between diazepam or midazolam plasma concentration and the 13 to 30 Hz (beta) spectral power change from baseline following intravenous doses (reprinted with permission, [114]). Each point represents the mean value for 11 study subjects. The solid lines represent the predicted concentrations based on a sigmoid Emax model fit to the data.