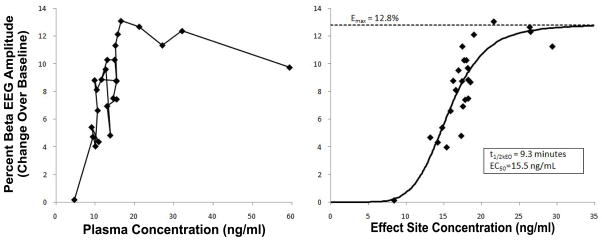
Figure 8.

A) Changes over baseline in percent 13–30 Hz spectral power in relation to plasma lorazepam concentration in a human volunteer. The direction of increasing time goes along the path from the top right to the bottom left and demonstrates a counter-clockwise hysteresis. B) Changes over baseline in percent 13–30 Hz spectral power in relation to hypothetical effect-site lorazepam concentration in the same subject, where the solid line represents the sigmoid Emax model of the data (data obtained and figure adapted from [117]).
