
Figure 2.
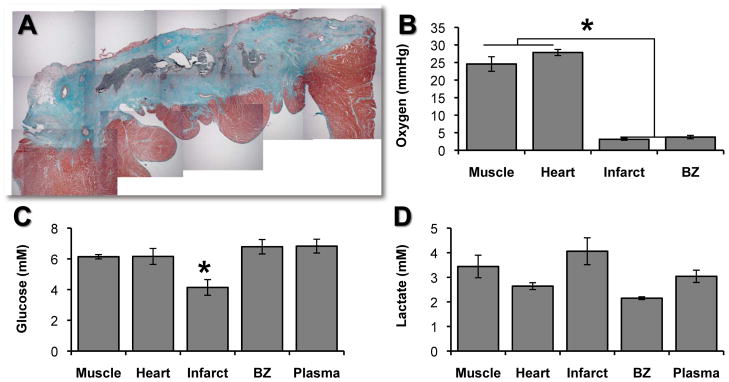
(A) Masson’s Trichrome stain of myocardial infarct showing location of microdialysis and oxygen probes(marked by reverse perfusion (microdialysis) or injection (oxygen probe) of 0.1% Evans blue dye). (B) Oxygen concentration is significantly lower in myocardial infarct scar than in skeletal muscle, uninjured heart, or borderzone (*p<0.05). (C) Glucose concentration in myocardial infarct scar was significantly lower than in the borderzone, plasma, or uninjured heart (*p<0.05). (D) Lactate concentrations measured in skeletal muscle, uninjured heart, myocardial infarct scar, infarct borderzone, and blood plasma varied widely in individual measurements within groups; there were no significant differences between groups. All bars are mean + s.e.m.