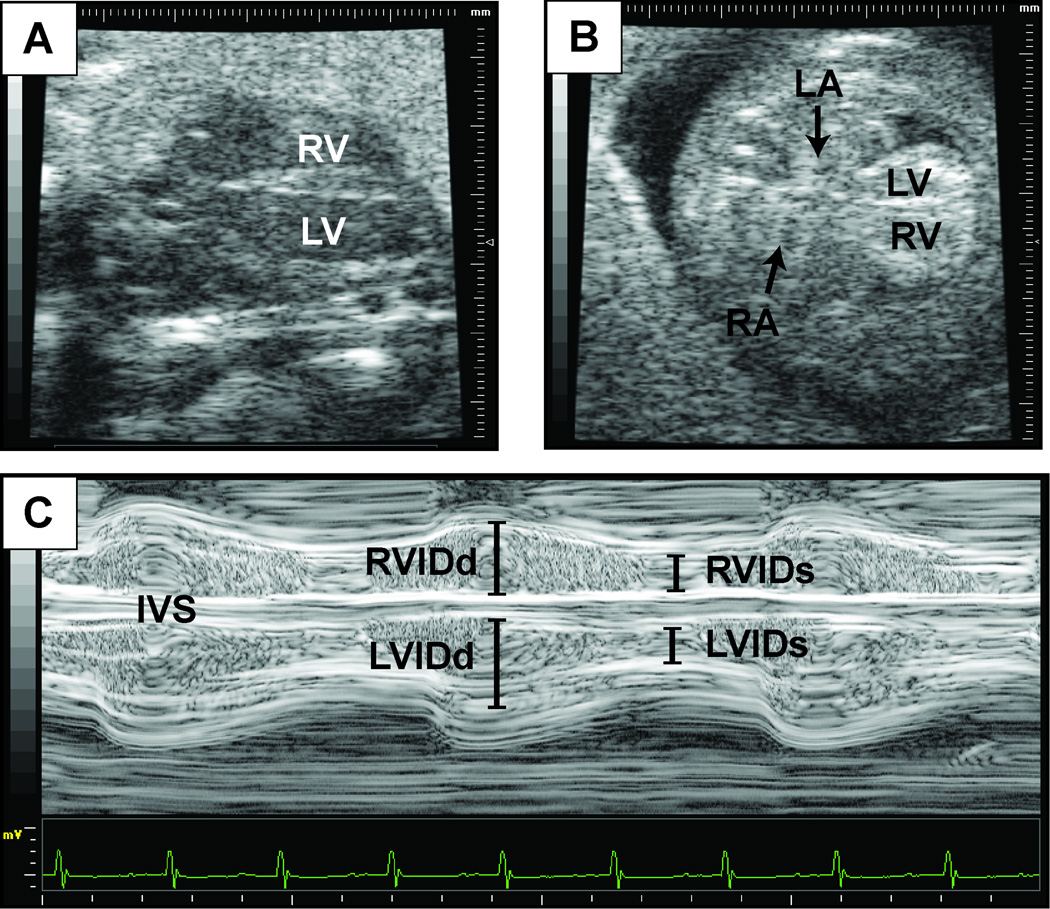
Figure 3. Representative assessment of ventricular function.
This figure contains representative images of 2D echocardiography of the long axis view of the heart at embryonic day 14.5 (A), and a four-chambered view (B). (C) M-mode tracing with lines indicating left and right ventricular internal diameter at diastole (R/LVIDd) and systole (R/LVIDs) from the four chamber image plane. Interventricular septum (IVS) is also visualized.

