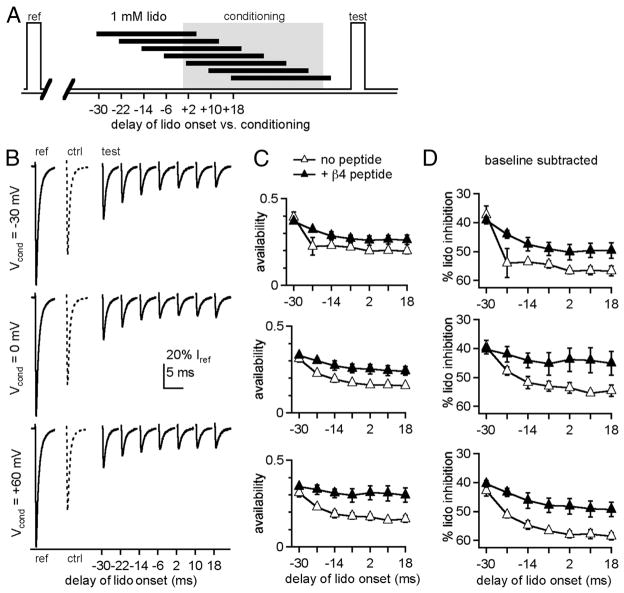
Figure 2.
Effects of lidocaine application time on inhibition of test currents. A, Schematic depicting application times of lidocaine during the standard protocol. B, Example traces from a CA3 neuron showing reference currents (left trace), control test currents with zero lidocaine (middle dotted trace), and test currents after 1 mM lidocaine application at different times, from earliest to latest (right solid traces), for conditioning: at −30 mV (top), 0 mV (middle), and +60 mV (bottom). All currents are normalized to the reference current for the sweep on which it was acquired. C, Normalized test currents recorded without (open triangles) and with (closed triangles) the β4 peptide versus delay of lidocaine onset relative to the conditioning step (n = 4, both conditions). D, Percentage current blocked by lidocaine (% lido inhibition), obtained by subtracting the zero-lidocaine (baseline) availability from the data in C, versus delay of lidocaine onset.

