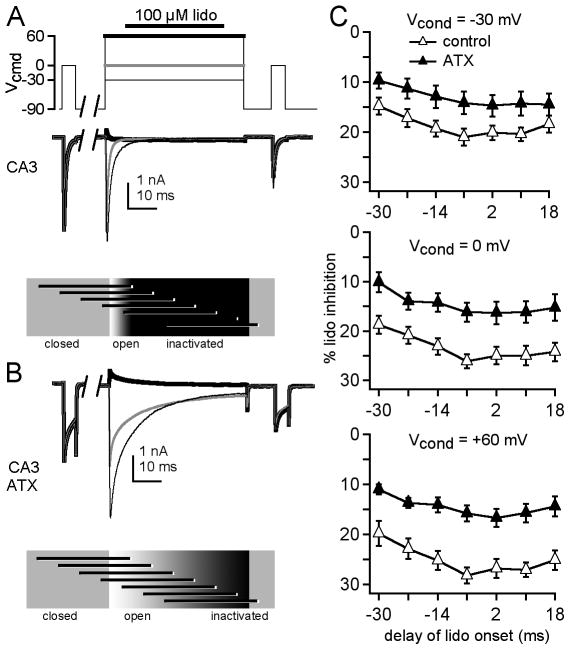
Figure 5.
Temporal profile of ATX-mediated relief of lidocaine inhibition in CA3 cells. A, B, Sample traces from a CA3 neuron, in control (A) and in ATX (B), in 50 mM extracellular Na, with conditioning: thin black line, −30 mV; gray line, 0 mV; thick black line, +60 mV, thick black line. C, Percentage lidocaine inhibition recorded without (closed triangles, n = 4) and with (open triangles, n = 6) ATX versus delay of lidocaine onset relative to the conditioning step.

