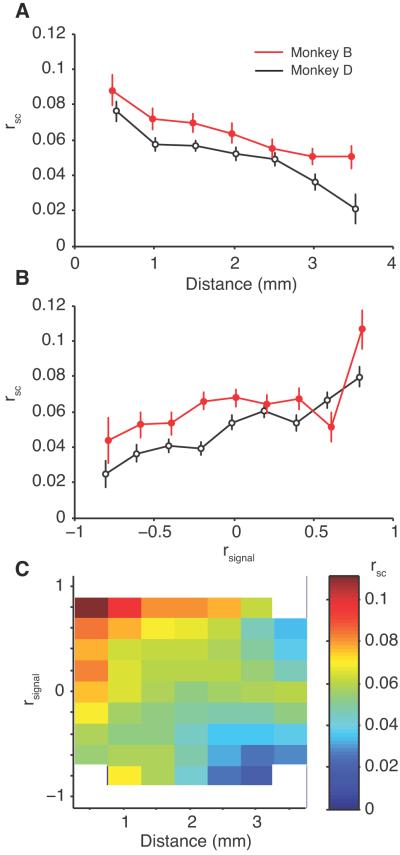
Figure 2.
Correlated variability. A, The average rsc for pairs of neurons as a function of distance. Neuronal pairs were grouped in 0.5 mm distance groups starting at 0.25 mm. The redB line represents data from Monkey B, while the black line represents data from Monkey D., Average rsc for pairs of neurons as a function of rsignal, or tuning similarity. C, The dependence of rsc on both distance and tuning similarity for the pooled data from both monkeys. Bins containing less than 10 neurons are removed (indicated with white). The scale of the surface plot is indicated by the bar at the right of the panel. The data in this and all subsequent surface plots were smoothed with a two-dimensional Gaussian (SD of 1 bin) for display purposes only.

