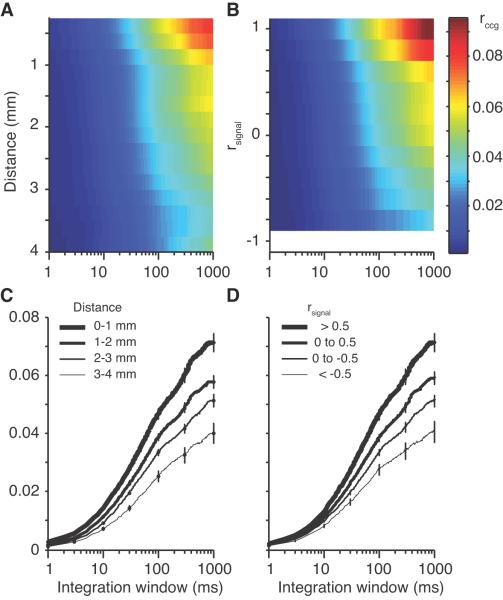
Figure 3.
Effect of distance and tuning similarity on the time scale of correlation. A, Surface plot showing the value of rsc as a function of the distance between electrodes for a range of integration windows (1 ms up to 1 s). All data in this figure are pooled from both monkeys. B, Analogous surface plot of the value of rsc, this time as a function of the tuning similarity (rsignal). The blank white region at the bottom indicates that no neuronal pairs had a rsignal value between −0.9 and −1.0. The scale bar for panels A and B is shown at the right. C and D, Line plots of rccg as a function of integration window taken for several cuts from the surfaces in A and B.

