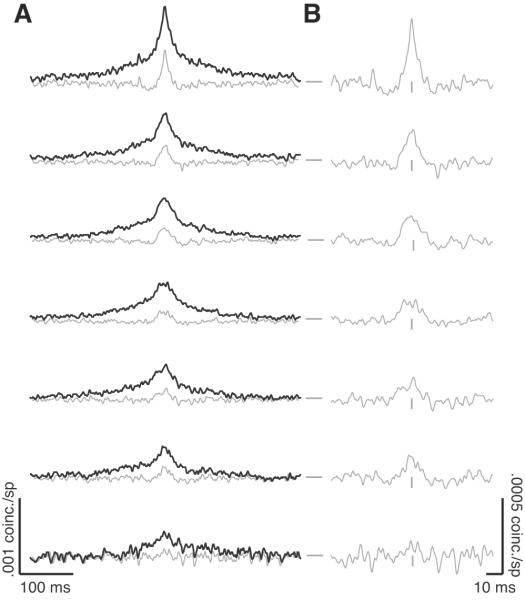
Figure 4.
Synchrony. A, Shuffle-corrected CCGs (black line) and jitter-corrected CCGs (gray lines, with a jitter window of 50 ms) for pairs of neurons in V4. Nearby neurons are shown at the top, and distant pairs at the bottom, in 0.5 mm bins. The vertical gray ticks represent zero time lag and the horizontal gray ticks represent 0 coinc./sp. Vertical and horizontal scale bars are shown at the bottom left. B, The same jitter-corrected CCGs as in A, but with an expanded vertical and horizontal scale (indicated with the scale bars at the bottom right).

