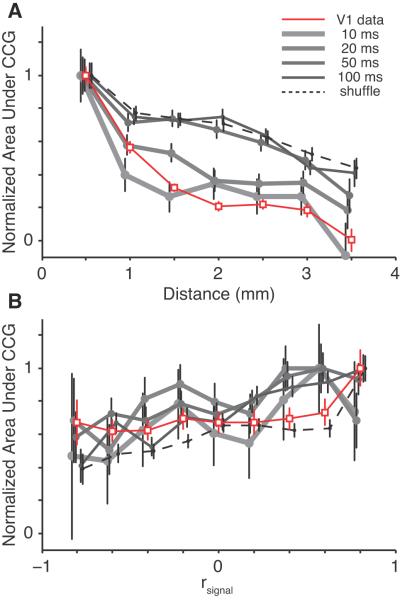
Figure 6.
Measuring the time scale of synchrony. A, Normalized synchrony (adjusted to a peak of one) as a function of distance between neurons. The dashed line represents the shuffle-corrected CCGs, the solid gray lines represent jitter-corrected CCGs of various temporal windows, and the solid red line represents V1 data from Smith and Kohn (2008), using a jitter window of 50 ms. In the V4 lines, the area under the peak is measured for plus and minus one half of the jitter window on either side of the zero time lag bin. For the shuffle-corrected CCG, area was measured under the entire CCG (±1 s). B, Normalized synchrony, with the same conventions as in A, plotted as a function of tuning similarity (rsignal).

