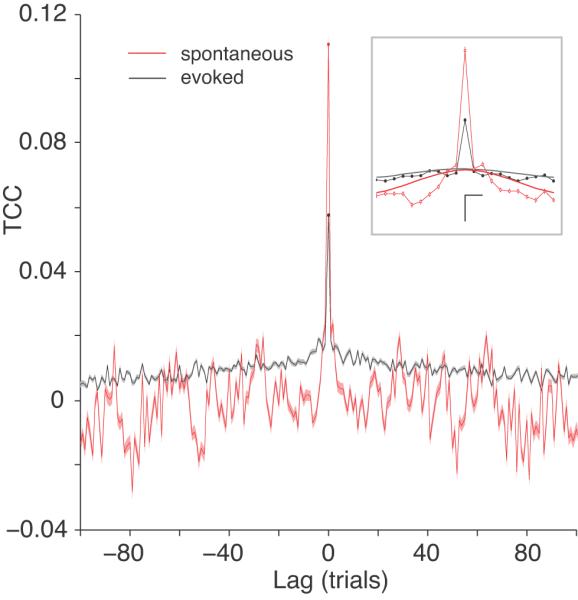
Figure 8.

Long time scale correlation. Here the trial cross-correlogram (TCC) is shown for spontaneous (red line) and evoked (black line) activity. The standard error of the mean around each data point is shown as a shaded region (red or light gray) around the TCC. The TCC shows the amount of correlated variability as a function of the trial lag between the responses of the neurons. For example, at lag of one trial, the responses of one neuron are correlated with the responses of another neuron collected during the subsequent stimulus. The value at a lag of zero trials is the same as rsc. The inset shows an enlarged view of the data near a trial lag of zero. The thick gray and red lines represent fits to the TCC data with the zero-lag point excluded (see Methods) for evoked and spontaneous data, respectively. The vertical scale bar represents. a TCC value of 0.02 and the horizontal scale bar represents a lag of two trial. The intersection of the two scale bars indicates the origin.
