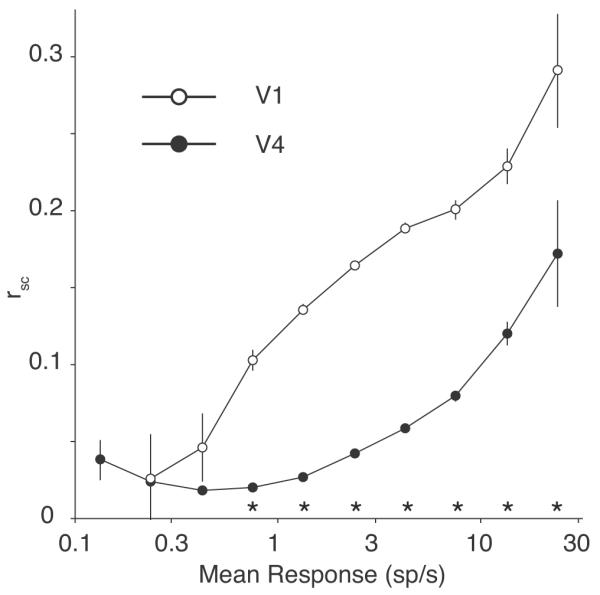
Figure 9.

Correlation and rate. The spike count correlation (rsc) is plotted here as a function of the mean firing rate of the neuronal pair for V1 (open circles) and V4 (filled circles). The V1 data are taken from Smith and Kohn (2008), recorded in anesthetized macaque monkey. Asterisks indicate a significant difference (p < 0.05, one-tailed t-test) between V4 and V1. For rate-matched groups of neurons, rsc is larger in V1 than V4 across a range of firing rates from 0.75 sp/s to the highest rates we recorded. Note that there were only 5 total pairs of V1 neurons that comprised the data for the leftmost two open circles.
