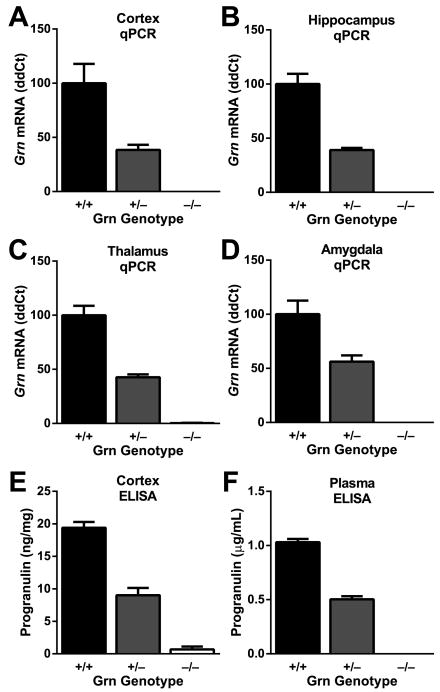
Fig. 1.
Progranulin levels in progranulin-deficient mice. A–D, Progranulin mRNA levels in cortex (A), hippocampus (B), thalamus (C), and amygdala (D). Relative expression levels quantified by qPCR were calculated using the ΔΔCt method and are displayed as a percent of the average level in wild-type mice (N = 5–6 mice per genotype; age = 19 months). E,F, Progranulin protein levels in cortex (E; N = 6 mice per genotype) and plasma (F; N = 17 mice per genotype), quantified by ELISA (age = 12 months).

