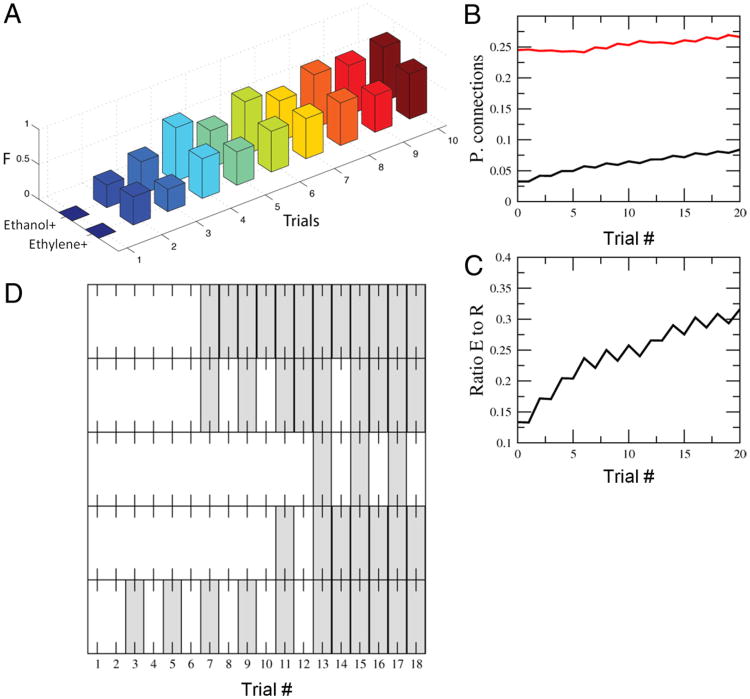
Figure 5.
Discrimination conditioning using artificial sensor array data. A, F-measure evolution of the model discriminating ethanol +/ethylene− and ethylene+/ethanol − from the database collected using the artificial sensor arrays. Note the similarities with Figure 2A. B, The evolution of the probability of forming connections into the extension (black) and retraction groups (red). C, The ratio between the number of connections to the extensor group divided by the connections to the retraction group. The number of connections into the extensor group increases but it does not need to reach a 50% level to be able to accurately solve the discrimination task. D, Illustration of the behavior in different iterations of the model. Some iterations showed a very consistent transition (top) where as others showed some degree of inconsistency. This is similar to the behavior data in Figure 1D. We used the same parameter values as in Figure 4.

