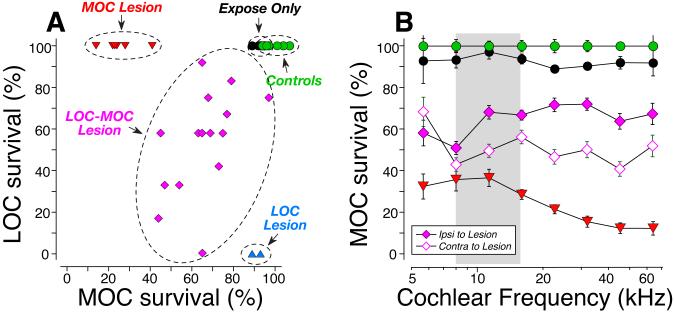
Figure 3.
Quantification of MOC and LOC de-efferentation. A: In each case, two confocal z-stacks similar to those in Fig. 2 were obtained from each of eight cochlear regions, evenly spaced from apex to base of the spiral. Techniques for estimating the loss of MOC and LOC terminals in each stack are described in Methods. Values for each ear represent the average of all stacks from all cochlear regions. For Controls (n=6 ears from 3 cases), Expose Only (n=6 ears from 3 cases) and COCB cut (MOC lesion) cases (N=8 ears from 4 cases), data are also averaged across both ears. For the unilateral LSO injections, only the data for the ipsilateral ear are shown. The LSO injection cases are segregated into two groups: 2 ears (from 2 cases) with “pure” LOC lesion, and the remaining 30 ears (from 15 cases) with combined LOC/MOC lesion. Data for MOC terminals are normalized with respect to Control animals. Data for LOC terminals are normalized by comparison between the two ears of one case. B: The mean survival (±SEM) of MOC terminals, as a function of cochlear location, for each of the groups in A, with the LOC-MOC lesion group further divided to separately show the ears ipsi vs. contra to the lesion (see key).

