Abstract
The study of intact, living cells using non-invasive optical spectroscopic methods offers the opportunity to assess cellular structure and organization in a way that is not possible with commonly used cell biology imaging techniques. We have developed a novel spectroscopic technique for diagnosing disease at the cellular level based on using low-coherence interferometry (LCI) to detect the angular distribution of scattered light. Angle-resolved LCI (a/LCI) combines the ability of LCI to isolate scattering from sub-surface tissue layers with the ability of light scattering spectroscopy to obtain structural information on sub-wavelength scales. In application to examining cellular structure, a/LCI enables quantitative measurements of changes in the size and texture of cell nuclei. These quantitative measurements are characteristic of different pathological states. The capabilities of a/LCI were demonstrated using a clinical system that can be applied in endoscopic surveillance of esophageal tissue, producing high sensitivity and specificity for detecting dysplastic tissues in vivo. Experiments with in vitro cell samples also show the utility of a/LCI in observing structural changes due to environmental stimuli as well as detecting apoptosis due to chemotherapeutic agents.
Introduction
The morphology of the cell nucleus can be a powerful indicator of the health of a cell as well as a means to identify its response to environmental stimuli. Light scattering has been shown to be a useful method for detecting changes in nuclear morphology for both cell biology studies [1–5] and clinical diagnostics [6–9]. Light scattering techniques are applicable to probing cellular substructure since the far-field scattering intensity distribution from objects whose dimension is comparable to the probing wavelength is extremely sensitive to small changes in size or shape. Thus, the optical properties of cells are highly responsive to changes in structure. In most light scattering measurements, the intensity of the scattered light is measured and diagnostic information is not provided as a function of depth in the tissue. However, by combining light scattering with the ability to obtain optical depth sections, angle-resolved low-coherence interferometry (a/LCI), has been shown to be a promising light scattering technique for analyzing cellular structure.
The a/LCI approach uses a low coherence interferometry scheme to obtain depth resolution, much in the way that optical coherence tomography (OCT) does [10–13]. However, while OCT seeks to image tissue microstructure using a scanned spot of focused illumination, the a/LCI approach instead uses a collimated beam and detects angular scattering as a means to assess sub-cellular structure. The a/LCI approach was first validated with cell experiments designed to confirm nuclear morphology measurements [14, 15] and animal experiments that enabled non-invasive detection of neoplastic transformation [16–18]. More recent advances have lead to new system architectures, new theoretical formalisms for signal analysis and significantly, new clinical applications.
In this chapter, we will review recent progress in the development and application of a/LCI for assessing cellular structure. First, the experimental systems used for a/LCI will be presented, including the table-top heterodyne a/LCI system and the portable clinical system with an endoscope compatible fiber optic probe. Next, an overview of analysis of scattered light for a/LCI measurements is presented, including a look at recent efforts to model aspherical nuclei. Finally, an overview of experimental results to date will be presented with a focus on recent clinical studies and applications to cell biology studies.
Experimental methods
Time-domain a/LCI
The first a/LCI systems were based on time-domain measurements, meaning that light from each depth within a sample was acquired sequentially. System geometries based on both the Michelson and Mach-Zehnder interferometers were developed [14, 19]. These systems provide depth resolution within a sample, in a method similar to time-domain OCT, by overlapping the light returned from a sample with a pathlength matched reference field. In time domain LCI systems, sub surface imaging data from a sample is resolved by mechanically translating a retro-reflector in the reference arm to match that particular depth in the sample. In a/LCI this approach is expanded to enable measurement of the angular distribution of scattered light. In the time domain a/LCI system, selection of scattering angles for detection is accomplished by scanning an imaging field lens in a direction perpendicular to the light path (Figure 1). These systems typically used a silicon photodetector to convert the optical signal to an electronic one with balanced photodetectors providing good noise rejection. By serially scanning the path length and scattering angle, two-dimensional maps of light scattered by the sample can be constructed as a function of sample depth and scattering angle. The angle-resolved measurements from particular sample depths can then be selected for analysis to provide structural information, such as the size of cell nuclei.
Figure 1.
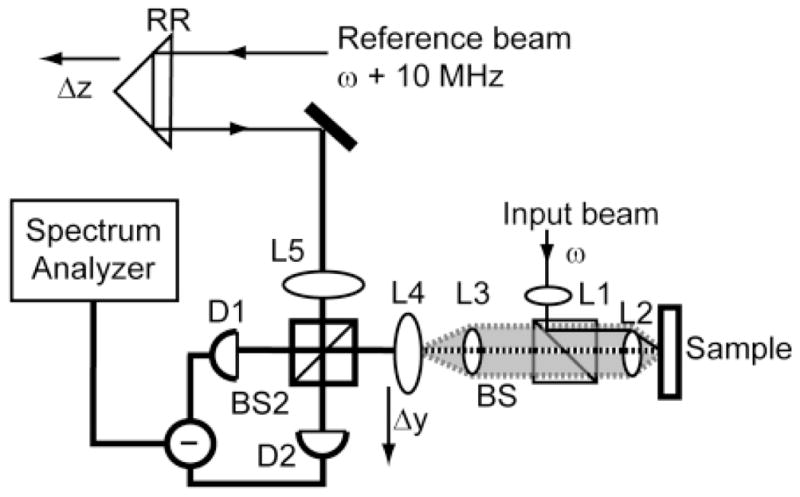
Schematic of a time domain a/LCI system. Axial translation of retroreflector (RR) scans the pathlength of the reference arm to enable optical sectioning via coherence gating. Lenses L1–L4 are configured as shown to permit a collimated incident on the sample, and L4 to lie in the image plane of the scattered light (shaded). By scanning L4, the intensity of scattered light is mapped as a function of the scattering angle. Taken from [19].
These time domain a/LCI systems were used for the first experiments that validated the approach for measuring nuclear morphology in cellular and animal models. Experiments with HT29 epithelial cancer cells showed that a/LCI could measure nuclear morphology with sub-wavelength accuracy [14]. Significantly, these initial experiments showed that a/LCI could be used to probe long range correlations and the fractal organization of these systems. The first application of a/LCI to detecting neoplastic transformation was the application of the time domain a/LCI system in the rat esophageal carcinogenesis model [20]. These experiments demonstrated 80% sensitivity and 100% specificity for detecting dysplasia based on nuclear morphology measurements in a retrospective analysis of 42 samples. This first study informed a second, prospective study in the same model that enabled prediction of dysplasia with 91% sensitivity and 97% specificity across 82 tissue samples [21]. In a later animal study, the time domain a/LCI system was used in a pilot study in the hamster traceheal epeithelium, demonstrating 78% sensitivity and 91% specificity for detecting dysplasia across 20 samples [16].
While the time domain system was highly useful for validating the a/LCI approach, providing high sensitivity and demonstrating sub-wavelength accuracy and precision in assessing nuclear morphology, the approach suffered from several limitations that prevented its translation to clinical application to detecting dysplasia in vivo. Advances in the time domain a/LCI approach reduced the measurement time significantly from the original versions, to just a few minutes [19, 22] but still was two to three orders of magnitude too slow to be acceptable for clinical use in live patients. The free space architecture of the time domain system also is better suited to examining ex vivo and in vitro samples which could be placed on a microscope stage. The Fourier domain systems described below were specifically designed to overcome these limitations.
Fourier-domain a/LCI
The widespread development of Fourier-domain methods for low-coherence interferometry and optical coherence tomography was spurred on by experimental studies that confirmed that these approaches could achieve higher signal fidelity and throughput than time-domain counterparts [23–25]. The Fourier-domain approach realizes these benefits by spectrally resolving the detected light, effectively enabling information from a range of tissue depths to be recovered in a single measurement rather than scanning the path length of the reference arm. In the Fourier domain a/LCI approach, scattering signals produce oscillatory spectral components with frequencies that are proportional to the depths from which they originate.
Fourier domain a/LCI also realizes a significant increase in acquisition speed by collecting data across the entire angular range simultaneously by resolving each scattering angle using the multiple channels of an imaging spectrometer [26]. The combination of parallel collection in the depth and angular domains results in a 104 improvement in acquisition time, enabling interrogation of a single point in a sample in as little as 40 milliseconds.
The final component required to enable application of a/LCI to in vivo tissues during endoscopic procedures was the development of a fiber optic probe. The first successful implementation of this approach was presented by Pyhtila et al. who used a coherent imaging fiber bundle to detect angle resolved scattering [27]. The fiber probe also incorporated a single mode fiber, laid alongside the imaging bundle, to deliver light to the tissue. Finally, to enable portability, the ultrafast laser used in previous a/LCI studies was replaced by a solid state light source, a broadband superluminescent light emitting diode (SLD) was used, greatly reducing system cost.
Clinical a/LCI system
The final design of the clinical a/LCI system adapted the Fourier domain engine with an endoscope compatible fiber optic probe, as described by Zhu et al. [28]. A schematic of the clinical system is shown in Figure 2. This system used a super luminescent diode (SLD), with a center wavelength λ0 = 832nm and a full width half max (FWHM) bandwidth ΔλFWHM = 19nm. The system design includes an optical isolator to prevent feedback due to backreflection of light into the SLD. The light is divided into a reference and sample arms using a 5% – 95% fiber optic splitter.
Figure 2.
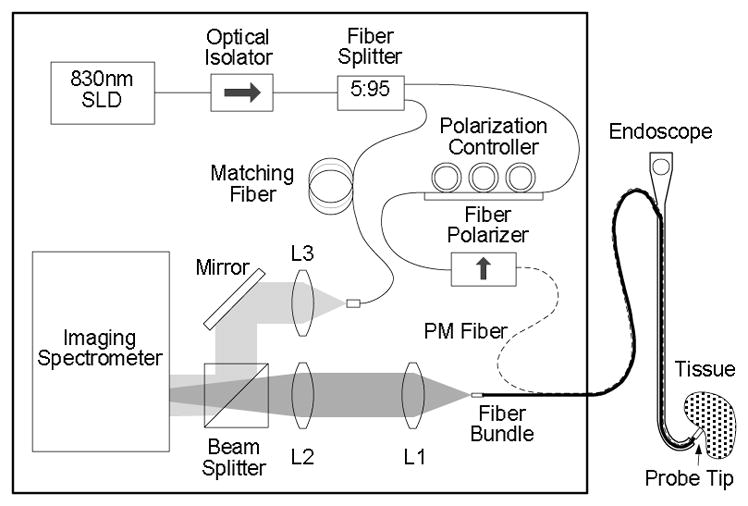
System configuration of clinical Fourier-domain a/LCI system. Adapted from Ref. [28]
The reference arm consists of a length of single mode fiber which has been pathlength matched to the round trip path of light delivered to the tissue and collected by the fiber probe. The reference arm light is collimated by lens L3 to enable overlap with the sample light in free space at a beam splitter. The collimation lens is placed on a translator to allow pathlength matching during alignment but remains fixed during system operation.
For the clinical system, the sample arm delivers light to the tissue replaces the single mode fiber with a polarization maintaining fiber to enable the polarization of the delivery light to be controlled using a an inline fiber polarizer. The distal end of the fiber optic probe collimates the light delivered to the sample using a short focal length drum lens which also collects the scattered light from the tissue. The scattered light is mapped to the face of a coherent fiber bundle (2.3 m long; 1.1 mm diameter; 18,000 pixels), located at the Fourier plane of the drum lens such that each element of the bundle receives light scattered at a particular scattering angle. Each element in the bundle carries the scattered light back through the fiber bundle to the interferometer where it is combined with the reference field. Lenses L1 and L2 image the angular distribution of scattered light onto the input slit of an imaging spectrometer.
The distal end of the probe tip is shown in cutaway in Figure 3. The PM fiber is positioned at the focal plane of the drum lens but offset from the optical axis such that light is delivered to the sample at an angle. This design enables the full angular aperture of the lens to be used to collect angular scattering but also minimizes specular reflection which can obscure the desired signal. The lens also collects the backscattered light (light gray) and maps the angular profile onto the distal face of the coherent fiber bundle. The distal end of the probe is sheathed in a protective cap consisting of a Teflon (PTFE) tube, that incorporates a glass window to provide a consistent interface between the probe and tissue. In order to further suppress specular reflection, the window is angled slightly relative to the optical axis, as shown.
Fig. 3.

Design of the distal end of the fiber probe used in the clinical a/LCI system. (a) Probe tip assembly showing sample illumination and scattering detection with fiber bundle. (b) Collection fiber bundle and delivery PM fiber with detection area highlighted. Adapted from Ref. [28]
To permit in vivo measurements of epithelial tissues during endoscopy procedures, the probe must be compatible with the accessory channel of standard endoscopes, with a typical diameter of 2.8 mm and a working length of 105 cm. The probe diameter of 2.3 mm and low coefficient of friction of the fiber probe, enabled by a PEEK sheath material, enables passage through the accessory channel.
The system was designed to fit in a small footprint (24″ × 18″) and installed on a 27″ × 18″ stainless steel utility cart, as shown in Fig 4., to permit compatibility in the endoscopy suite. Figure 3 (b) illustrates the compact design of the internal components of the clinical a/LCI system.
Fig. 4.
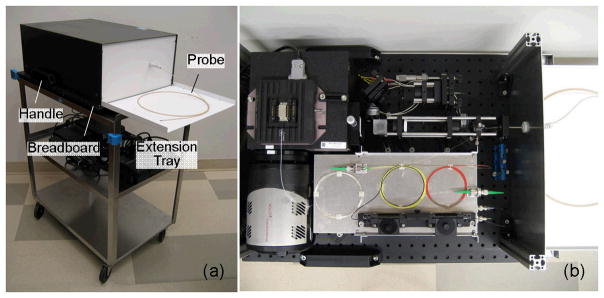
Clinical a/LCI system. (a) Enclosed system on the cart with the extension tray installed. (b) System detail with top cover removed. Adapted from Ref.[28].
Signal Analysis
The a/LCI scattering signal is analyzed to determine the structure of scatterers in the sample of interest. The angular distributions are compared to a theoretical basis, such as Mie theory in order to assess the most likely scattering geometry [26, 29]. It has been shown that the angular distribution of the scattered intensity is related to the two-point spatial correlation function of the optical field through a Fourier transform [14]
| (1) |
where r is the length scale of the spatial correlations along the transverse direction given by the angle θ.
An important implication of this relationship is that the angular scattering distribution can be filtered to isolate components characteristic of length scales of interest. In assessing scattering from cell nuclei, with typical diamteres of 7–15 μm, the angular distribution is typically low pass filtered to remove scattering from structures at longer length scales such as coherent scattering from adjacent cells. Scattering by smaller structures, such as other subcellular organelles and nuclear sub-structure, also contribute to the scattering distribution. Since the frequency of oscillations due to these smaller structures is generally larger than the range of angles detected in a/LCI, these contributions can be removed by de-trending the data using a second-order polynomial fit which is subtracted to leave only the contribution from the cell nuclei.
Once the scattering component due to nuclei has been isolated, it is then compared to a theoretical basis, typically Mie theory. The comparison is enabled by creation of a database of scattering distributions, calculated using Mie theory, that cover a range of nucleus diameters, size distributions and relative refractive indices. The fitting process consists of calculating the mean squared error between the data and each entry in the database with the theoretical solution that best fits the detected signal deemed to be the average nuclear size distribution in the probed area and selected depth segment [19, 30].
In recent studies, T-matrix calculations have been examined as an alternative theoretical basis to Mie theory for a/LCI analysis. The T-matrix method provides an efficient way to simulate scattering from spherical, spheroidal and other more complicated geometries. In order to simulate a large number of scatterers, a software program was developed that runs T-matrix simulations across numerous PCs, effectively reducing computation time by a factor of the number of processors available. This software is based on the extended precision (128 bit) public domain T-matrix code provided Mishchenko and was used to generate a light scattering database of spheroidal particles [31].
To increase access to information about cellular substructure, a fractal dimension formalism has recently been implemented in the a/LCI algorithm. It has been shown (including [14]) that there is a fractal nature to the organization of biological materials: their organization is scale-free over at least several decades. In practice, this implies that the spatial correlations can be described by a power law, and characterized by the exponent of the spatial correlations α = D-3 where D is the mass fractal dimension [32]. Experimentally, the spatial correlations are given by the Fourier transform of the angular distribution of scattered light. Therefore, a/LCI, by measuring the angular distribution of scattered light, gives direct access to the fractal dimension of a biological sample. Physically, fractal dimension, can be viewed as a measure of the texture of an object: as a mass distribution transitions from a fine, smooth structure to a coarser, grainer structure, the fractal dimension increases.
Results
Clinical application to dysplasia in Barrett’s esophagus
The clinical a/LCI system was primarily developed as a means to detect the enlarged cell nuclei characteristic of dysplasia in Barrett’s esophagus (BE) tissue. BE is a metaplastic tissue that can arise in response to chronic acid reflux into the esophagus. BE patients have a 30–125 fold increased risk of developing esophageal adenocarcinma, a deadly disease with a 5-year survival rate of only 15% [33, 34]. Because of this increased risk, BE patients are routinely monitored for early signs of cancer via upper endoscopy with four quadrant biopsy. By providing an alternate means to assess tissue health, a/LCI nuclear morphology measruements have the opportunity to significantly improve this standard of care. We now describe three a/LCI studies of BE tissues. The first two examined ex vivo resected esophageal tissues, in laboratory and clinical settings [29, 35]. The third study was a pilot clinical trial in patients undergoing routine surveillance for BE which compared a/LCI measurements to co-registered traditional biopsies to assess the accuracy of the approach in detecting dysplasia [36].
Ex Vivo Studies
The first a/LCI study of human esophageal tissue examined surgically resected BE tissue using a Fourier domain system with an early version of the endoscopic probe. [35]. Tissue samples from three patients with dysplastic BE who underwent esophago-gastrectomies were examined in the laboratory within 2 hours of surgery. The tissue was examined at multiple points with the a/LCI probe and the sites marked with India ink. For each biopsy sample, the mean size and average refractive index of the cell nuclei was assessed using a/LCI and compared to the histological diagnosis. The approach was able to distinguish between dysplastic tissue and gastric columnar epithelium, used as a control, with a sensitivity and a specificity of 100% (n = 18).
A subsequent a/LCI of ex vivo tissue was conducted with a portable system in a surgical setting [29]. This system advanced the design of the endoscopic probe to create a wand that could be manually manipulated to probe tissue sites. To demonstrate the function of the portable system, fifteen points were examined on a single resected tissue specimen. This study also demonstrated that deeper measurements, at the basal layer of the epithelium, approximately 250–300 mm beneath the tissue surface were better able to distinguish tissue type, producing 100% sensitivity and 78% specificity.
In Vivo Study
The clinical a/LCI system was used to conduct a pilot study to assess the feasibility of using the approach to detect dysplasia in vivo [36]. The study design applied the a/LCI fiber probe during routine endoscopy surveillance procedures for BE patients. For each patient enrolled, a/LCI nuclear morphology measurements were taken at 3–6 random sites selected by the endocsopist followed by physical biopsy at the same location. Coregistration was enabled by a small temporary indentation left in the tissue after application of the a/LCI probe. The probe can be seen applied during an endoscopy in Figure 5(a). Figure 5(b) shows the indentation left by the probe after application with contrast enhanced by narrow band illumination (NBI). Following the procedure, the physical biopsies were sent for processing and reviewed by a pathologist to arrive at a classification. Each tissue diagnosis was compared with the a/LCI nuclear morphology measurements to assess the accuracy of the approach.
Figure 5.
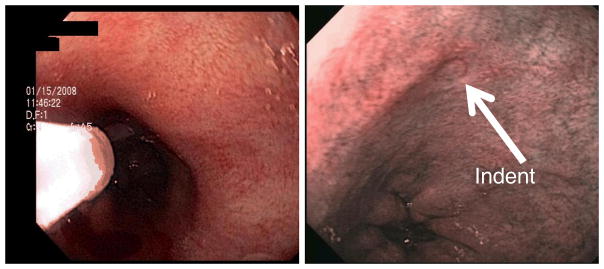
(Left) Application of fiber optic a/LCI probe during endoscopic examination of the esophageal lumen. (Right) temporary indentation left by a/LCI probe under narrow band illumination. Adapted from Ref [36]
Forty six (46) patients were scanning using the clinical a/LCI system at two clinical sites. In total, one hundred seventy two (172) paired a/LCI measurements and physical biopsies were collected. Each biopsy was classifieds at as BE with high-grade dysplasia (HGD) (5), BE with low-grade dysplasia (LGD) (8), BE indeterminate for dysplasia (14), non-dysplastic BE (NDBE) (75), normal gastric tissue (31), normal squamous tissue (22) or normal squamo-columnar tissue which contained both normal and squamous tissue types (17). Tissue samples classified as dysplastic were read by a second pathologist to verify their diagnosis. In the case of disagreement, a consensus was reached by the pathologists. Samples identified as HGD and LGD were considered dysplastic, while samples identified as indeterminate for dysplasia, NDBE, normal squamous, normal columnar and normal squamo-columnar tissue were considered negative for dysplasia. This classification is typical of the current clinical treatment protocols dictated by the evaluation of the physical biopsies.
At each site scanned by a/LCI, the nuclear morphology data were analyzed by depth beneath the tissue suface in one hundered micron segments. For each depth segment, the 10–30 individual acquisitions for that tissue size were averaged to produce a consensus size for that site and depth segment. The nuclear morphology for the basal layer of the epithelium, 200–300μm showed significant differences between non-dysplastic and dysplastic tissue types Figure 6. A scatter plot of the mean nuclear size and average refractive index for this tissue layer appears in Fig. 7. The sensitivity and specificity of these measurements for detecting dysplasia were assessed by generating a receiver operating characteristic (ROC) curve. Using the mean nuclear size as the discriminating characteristic, and area under the curve (AUC) was found to be 0.91, indicating a strong correlation with dysplasia.
Figure 6.
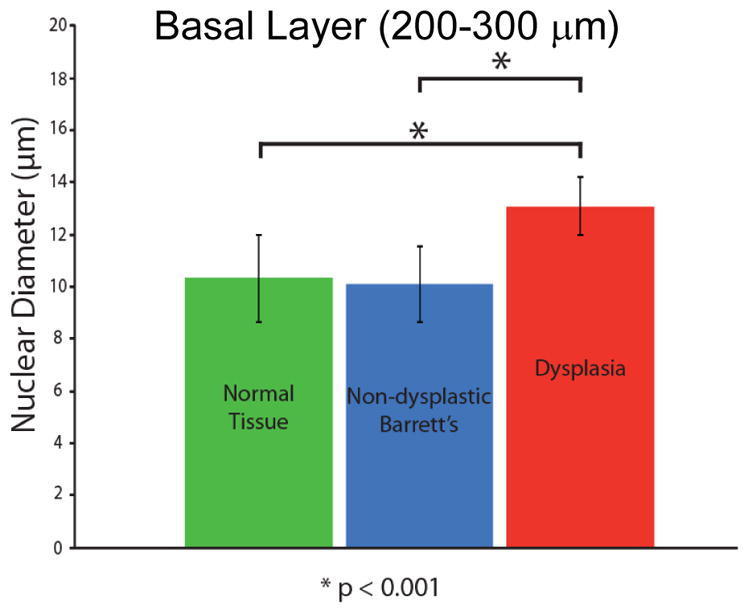
Comparison of a/LCI measurements of nuclear morphology from in vivo study of Barrett’s esophagus epithelium. A statistically significant increase (P<.001) is seen for sites identified as dysplastic by pathological evaluation of biopsy samples compared with normal tissue types and non-dysplastic Barrett’s esophagus tissue. Adapted from [36]
Fig. 7.
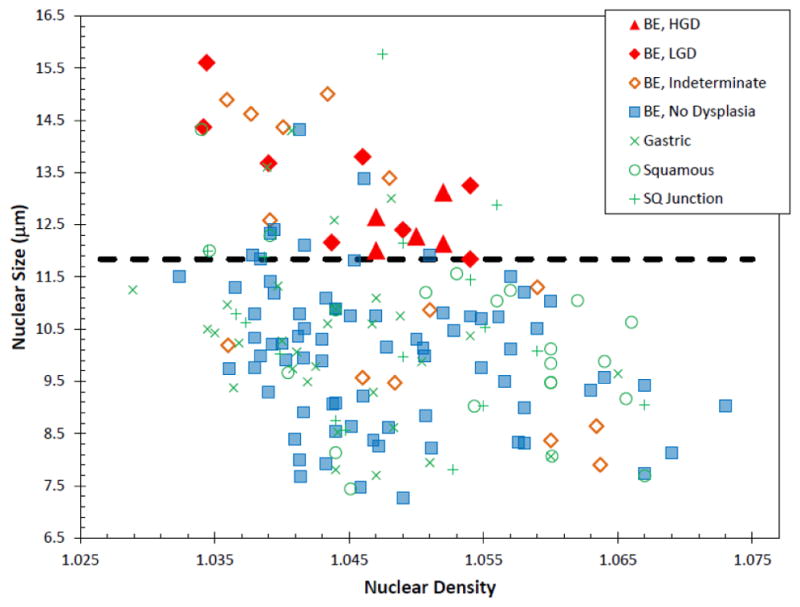
In vivo basal layer scatter plot for BE study. Each point represents a single optical biopsy and is color-coded by its pathological diagnosis. Dotted black line represents decision line. Taken from Ref. [36]
The ROC suggests a decision line of 11.84 μm for this layer, producing a sensitivity of 100% (13/13) and a specificity of 84% specificity (134/159) for distinguishing dysplastic from non-dysplastic biopsies. This corresponds to a classification accuracy of 86% (147/172 biopsy sites), a positive predictive value (PPV) of 34% (13/38) and a negative predictive value (NPV) of 100% (134/134).
Statistical analyses were used to assess the association of diagnosis with morphological nuclear characteristics after adjusting for other relevant factors. Following adjustment for age and clinic site, nuclear diameter in the mucosal layer 200–300 μm beneath the surface was found to be positively associated with the presence of dysplasia at a significant level (p=0.0001). In addition, increased nuclear density in the same depth segment was found to be negatively associated with the presence of dysplasia at a significant level (p=0.0009).
Discussion
The ability to measure nuclear morphology in situ makes a/LCI a potentially powerful tool in detecting dysplasia in tissues at risk for developing cancer. These tissues often present no visible cues at the tissues surface, resulting in the need for systematic biopsy to evaluate tissue health. The a/LCI technology development has focused on a delivering a diagnostic modality suitable for monitoring patients with BE during upper gastrointestinal endoscopy. However, the approach could be broadly applicable to detecting dysplasia in a wide variety of epithelial tissues. While adapting the approach to most effectively survey other tissue sites, such as the colon, cervix and oral cavity might require development of new instrumentation; the underlying principle of detecting enlarged nuclei remains a constant feature of dysplasia across these tissue types.
Cell biology
In addition to development for clinical application, the a/LCI technology has proven to be useful for cell biology studies by exploiting the size and shape of the cell nucleus as a marker for the influence of external stimuli. In typical cell biology study, the nuclear morphology data is acquired via analysis of microcopy images of individual cell nuclei. This can be a laborious task and may limit the impact of studies when the number of measurements is too small to produce statistical significance. Instead, a/LCI offers a means to rapidly assess the average nuclear size in a population of cells in a single measurement of just a few minutes, in the case of the benchtop time domain system. Here we present a few examples of studies of nuclear morphology that were used to inform analysis of biophysical cell properties.
Deformation of chondrocyte cell nuclei due to osmotic loading
Chondrocytes are the sole type of cell within articular cartilage, the connective tissue found between bones that distributes mechanical loads. The behavior of these cells is strongly in uenced by shape and volume changes occurring due to mechanical and osmotic stresses [37]. The volume of isolated chondrocytes is sensitive to the osmolarity of the surrounding medium. Changes in chondrocyte volume are accompanied by a corresponding change in the nuclear volume, independent of cytoskeletal integrity [38]. In a recent a/LCI study, small changes in nuclear volume were induced by changing the osmolarity of culture medium of in vitro chondrocytes and measured with a/LCI analysis of unstained cells, and verified through more traditional analysis of confocal microscopy imaging of fluorescently labeled, unfixed cells [39].
In the a/LCI study, chondrocytes were seeded at high density in chambered coverglasses and exposed to 500, 400 and 330 mOsm saline solutions, in that order. It would be expected that the nuclear size would increase with these conditions, given the equilibration of the nucleus intrinsic to changing ionic conditions. Figure 8 shows the trends in nuclear diameter, as measured with a/LCI. The mean nuclear size increased from 6.34 ± 0.26 μm, 6.65 ± 0.15 μm, to 6.92 ± 0.20 μm with decreasing osmolarity Statistically significant differences (p = 0.055 for 330–400, p = 0.046 for 400–500, and p =0.002 for 330–500 mOsm) were observed between each set of measurements.
Figure 8.
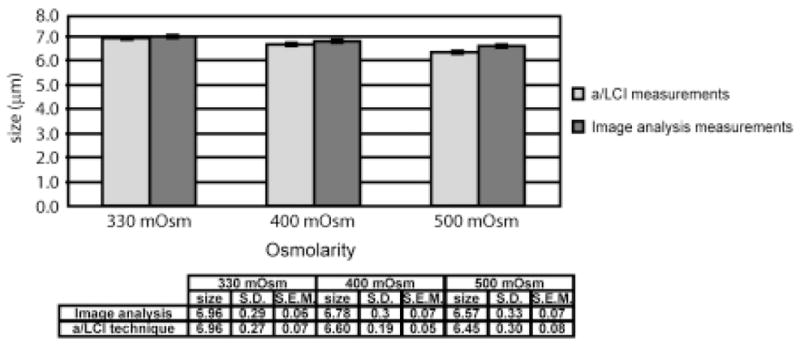
Comparison of measurements of porcine chondrocyte cell nuclei using (a) image analysis and (b) the a/LCI technique. The error bars correspond to mean ± SE (standard error of the mean in the 95% confidence interval). Both experiments demonstrate a statistically significant (p < 0.05) increase in nuclear size with decreasing osmolarity. Taken from [39].
The accuracy of these measurements was assessed through analysis by fluorescence confocal microscopy. Isolated chondrocytes were imaged at 500, 400 and 330 mOsm saline solutions, in that order (Figure 9). The diameters of the nuclei were measured to be 6.57 ± 0.07 μm, 6.78 ± 0.07 μm, and 6.96 ± 0.06 μm respectively. Statistically significant differences (p = 0.01 for 330–400, p = 0.0001 for 400–500, p = 0.000001 for 330–500) were observed between each set of measurements. A graphic comparison of the a/LCI and imaging analysis measurements are presented in Figure 8.
Fig. 9.
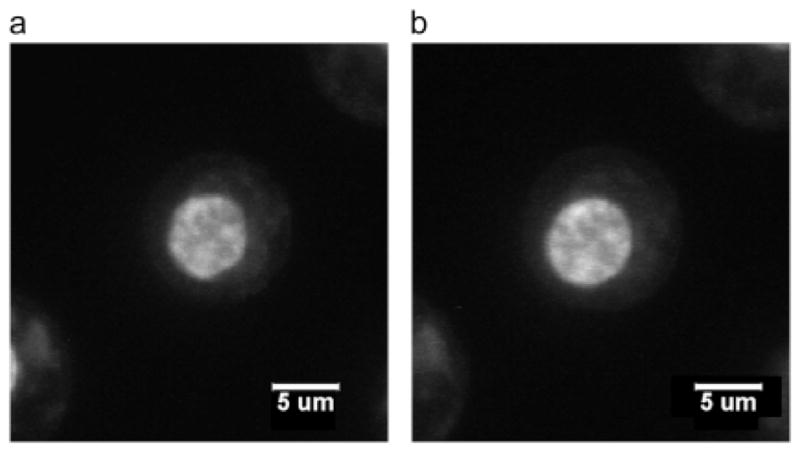
Confocal images of stained chondrocyte cell nucleus equilibrated at (a) 500 mOsm and (b) 330 mOsm. At 500 mOsm, the cell nucleus is smaller and less rounded than the cell nucleus equilibrated at 330 mOsm, which is a typical observation in this experiment. Taken from [39].
The advantage of using a/LCI for these measurements becomes apparent upon considering the required effort for each method. For the image analysis, including labelling, confocal imaging and analysis of the chondrocyte cell nuclei, a full day’s effort yielded measurements of 82 cells for each osmolarity used, corresponding to a measurement rate of roughly 20 cell nuclei/hour. In contrast ten measurements of the cells were made at each osmolarity using a/LCI in approximately four hours. Since each a/LCi measurement probes roughly 100 cell nuclei, the measurement rate was 1000 cell nuclei/hour, a 50 fold increase in throughput.
Deformation of macrophage cell nuclei induced by topography
Some cell types, such as smooth muscle cells and mesenchymal stem cells have been observed to align and elongate significantly when cultured on patterned surfaces with features in the submicron size range [40, 41]. Such changes in cell morphology often are accompanied by other characteristic phenotypic changes such as altered proliferation, motility, and gene expression. The cell nucleus is also observed to deform in response to topographical cues, providing an interesting target for a/LCI measurements. As a model system of cell nucleus deformation due to topographical cues, an a/LCI study of murine macrophages was conducted [39].
Figure 10 shows example images of murine macrophage cells on planar controls and patterned substrates, demonstrating a net elongation of the cell nuclei. Based on analysis of T-matrix simulations of elongated spheroids, we hypothesized that the aspect ratio of these elongated cell nuclei could be determined using Mie theory and multiple measurements in different orientations and incident polarizations. In the simulations ([42]), we saw that Mie theory can be used to deduce nuclear shape, but that deduction is based vitally on the orientation of the sample with respect to the direction of light polarization.
Figure 10.
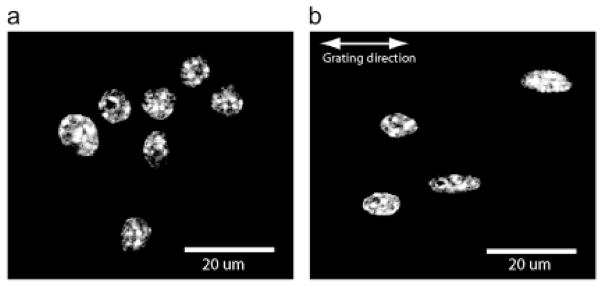
Fluorescence microscopy images of DAPI stained murine macrophage cell nuclei in planar control configuration (a) and on 2-μm PDMS grating (b). Elongation of nuclei along the direction of the grating is clear compared to planar controls Taken from [39].
The results of this study are presented in Figure 8. Image analysis of DAPI-stained cell nuclei showed that the planar control samples exhibited an average size of 5.89± 0.22 μm. Upon comparison of major and minor axes of these cell nuclei, it was found they were slightly spheroidal with a with a major axis of 6.46 ±0.13 μm and a minor axis of 5.31 ± 0.10 μm, yielding an aspect ratio (ratio of minor to major axes) of 0.83 ± 0.01. Measurements with the a/LCI technique yielded a size of 6.46 ± 0.38 μm on the planar control, which accurately agreed with the major axis measurement. Here the sample orientation and incident polarization could not be varied due to the random orientation of the cell nuclei on the planar controls.
On the nanopatterned substrates, cell nuclei were aligned along the direction of the grating. Image analysis of these nuclei produced a measurement of the major axis of 10.30 ± 0.42 μm and a minor axis of 6.39 ± 0.34 μm, corresponding to an aspect ratio of 0.62 ± 0.02. There was a highly statistically significant difference (p = 0.00001) between the elongation of cell nuclei on the planar controls compared with that of the nuclei on the nanopatterned samples.
The a/LCI system was applied to measure the structure of these spheroidal nuclei by combining measurements in four configurations, corresponding to the four combinations of parallel and perpendicular incident light polarization, and sample orientations along the x- and y-axes of the optical setup. In each configuration, there was a bimodal distribution of sizes, with one group of measurements within the 95% confidence interval of the planar control at 6.50 ± 0.23 μm, and a second widely separated group of size measurements significantly larger than the mean of the planar control measurements at 10.53 ± 0.47 μm. These measurements are in very good agreement with the image analysis measurements of the major and minor axes of the cell nuclei (6.39 ± 0.34 μm and 10.30 ± 0.42 μm, respectively). The measured aspect ratio using the a/LCI technique, 0.62 ± 0.04, is in exact agreement with the aspect ratio measured by image analysis, 0.62 ± 0.02.
T-matrix analysis of a/LCI measurements: spheroids
As shown above, a/LCI measurements of spheroidal scatterers can be analyzed using Mie theory in situations where it is feasible to combine multiple measurements acquired using different orientations and polarizations. As an alternative, we have developed a new analysis approach that uses the T-matrix method [43] that enables determination of both nuclear equal volume diameter (EVD) (defined in terms of the diameter of an equal volume sphere) and the spheroidal aspect ratio using a single measurement.
To evaluate the accuracy of analysis based on the T-matrix method, MCF7 breast cancer cells (Figure 12) were studied with time domain a/LCI system [44]. After the light scattering measurements, cells were fixed, stained and imaged. The cell nuclei were measured using quantitative image analysis, yielding an EVD of 9.52 μm with a 95% standard error of 0.44 μm, In comparison, a/LCI with T-matrix analysis produced an EVD of 9.51 μm ± 0.34 μm. Good agreement was also found in analysis of the cell nuclei aspect ratio with 0.70±0.026 determined by image analysis and 0.69±0.032 by a/LCI. While analysis with Mie theory yielded an average size measurement of 9.47±0.34 μm, in good agreement with the EVD of the T-matrix and image analysis results. However, the Mie theory analysis could not make a determination of the spheroidal aspect ratio.
Figure 12.
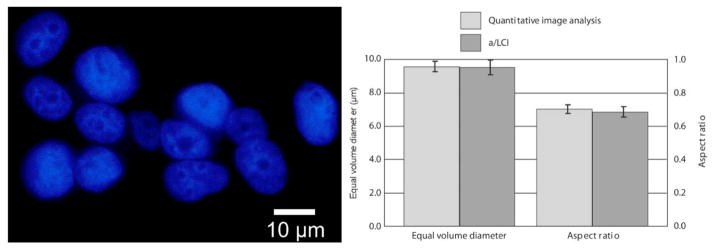
(Left) Fluorescence microscopy image of MCF7 nuclei using DAPI. Nuclei are approximately spheroidal and randomly aligned. (Right) Measurements of equal volume diameter and spheriodial aspect ratio by QIA using DAPI stain, and a/LCI using live cells. Error bars are standard error at 95% confidence. Adapted from [44].
Detecting apoptosis using light scattering
With a/LCI shown to be highly sensitive to changes in subcellular structure, the method was applied to study apoptosis in MCF-7 breast cancer cells The study was able to sensitively detect early changes in response to apoptosis-inducing chemotherapeutic drugs [45]. The study employed fractal dimension as a metric to assess the organization of subcellular structures and its modulation due to apoptosis.
Significantly, this study was enabled by the use of T-matrix theory-based analysis. As described above in the signal analysis section, the fractal dimension can be determined by analyzing the residual light scattering signal after accounting for the signal due to the nucleus. When analyzed by Mie theory, the fractal dimension did not produce a discernable trend in response to apoptosis. However, analysis with the T matrix method produced a trend that indicated an increase in mass fractal dimension with the onset of apoptosis.
MCF-7 cells were treated with 5 nM paclitaxel and their nuclei were measured with a/LCI at multiple time points. The EVD and aspect ratio of the MCF-7 cell nuclei measured with a/LCI showed excellent agreement with the results of image analysis of DAPI-stained samples to a high degree of accuracy but no significant changes were observed during these experiments using either method. However, the fractal dimension showed an increase from D = 1.63 ± 0.44 (in the form of mean ± SD) to D = 2.13 ± 0.13 from t = 0 to 3 h, but then retreated at t = 6 h to 1.95 ± 0.17. At later timepoints, the fractal dimension increased to 2.00 ± 0.24 and 2.02 ± 0.14 at 12 and 24 hours, respectively. The fractal dimension of control cells ranged from 1.50 to 1.70 with SD ranging from 0.20 to 0.40 such that the fractal dimension of cells at t = 3, 12, and 24 h showed statistically significant differences (Figure 13). To investigate if changes could be detected at earlier time points, MCF-7 cells were treated with 5 nM paclitaxel and compared to control cells at t = 1.5 h post treatment. Analysis of data at this timepoint using the T matrix method, yields a fractal dimension of D = 2.05 ± 0.20 compared with D = 1.59 ± 0.26 for the control cells, a statistically significant difference (p<0.05).
Figure 13.
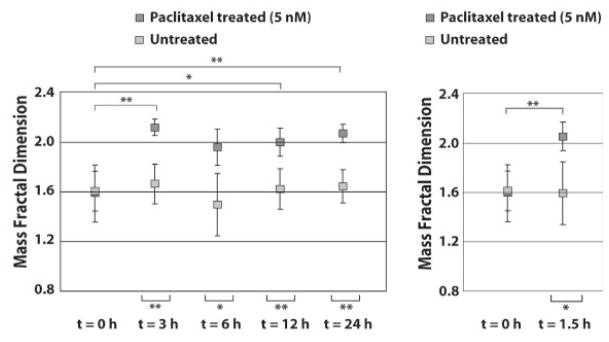
Fractal dimenstion of MCF-7 cells shows a significant change in response to 5 nM treatment with Paclitaxel at t = 3,6,12 and 24 h post treatment. (Right) Comparison of cells treated with 5 nM Paclitaxel and controls at t = 1.5 h. * indicates statistical significance (p < 0.05) and ** indicates high statistical significance (p < 0.001). Adapted from [45].
As a means to assess the validitiy and utility of these light scattering measurements of fractal dimension, we compared them to the fractal dimension found from analyzing images of samples stained with DAPI for nuclear contrast and Mitotracker green (Figure 14). For analysis of cell nuclei, the box-counting fractal dimension was seen to increase for treated cells from 1.62 ± 0.08 at t = 3 h to 1.64 ± 0.05 at t = 6 h to 1.71 ± 0.08 at t = 12 h and t = 24 h. For control cells, this metric did not show a change and was calculated to be between 1.60 and 1.62 at all time points. For analysis of the mitochondria, the fractal dimension of treated cells at t = 3 h was 1.65 ± 0.07 while that of control cells at t = 3 h was 1.60 ± 0.06. The box fractal dimension of treated cells at t = 6 h was 1.60 ± 0.08 while that of control cells at t = 6 h was 1.56 ± 0.08. Finally, the box fractal dimension of treated cells at t = 12 h was 1.63 ± 0.06 while that of control cells at t = 12 h was 1.59 ± 0.07. At each time point, the difference in box fractal dimension between treated and control cells is statistically significant (p < 0.05), and the difference at t = 3 h and t = 12 h is highly significant (p < 0.001).
Figure 14.
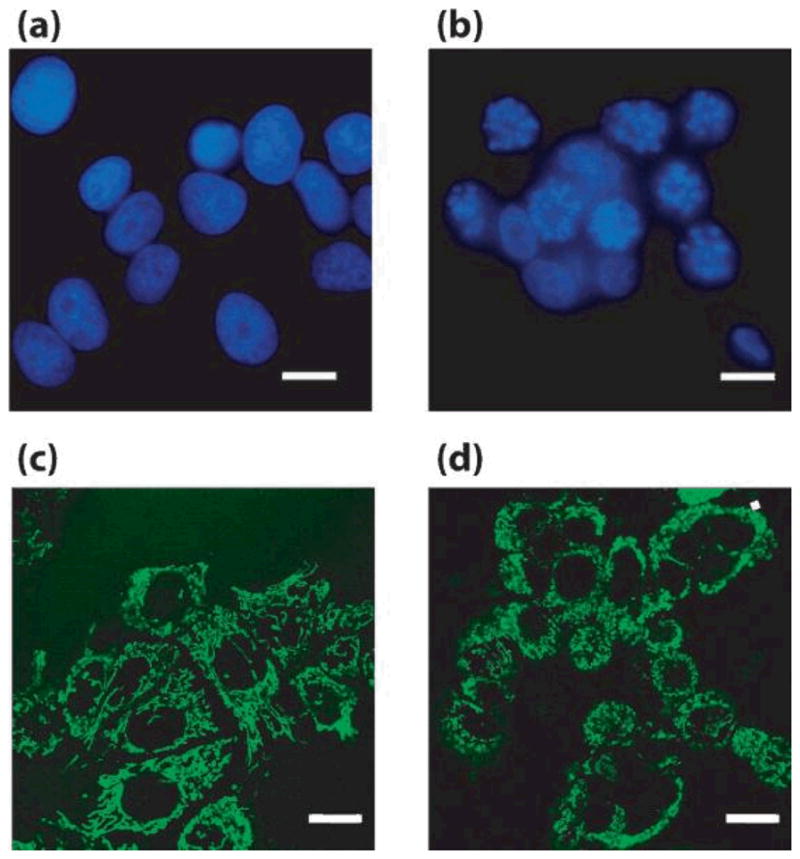
Representative images from DAPI (a,b) and MitoTracker (c,d) stained control (a,c) and paclitaxel-treated (b,d) MCF-7 cells Scale bars = 10 μm. Adapted from [45]
The expected trend in the a/LCI data was that as cells underwent apoptosis, the fractal dimension would increase due to nuclear fragmentation and chromatin condensation. Analysis of the images of DAPI-stained nuclei did confirm that changes in the organization of nuclear material were seen at 12 and 24 hours post administration of paclitaxel. The finding of early changes in the a/LCI measured fractal dimension was surprising and lead to the investigation of mitochondrial organization based on previous light scattering studies that linked apoptosis to mitochondrial morphology [46, 47]. Analysis of images of Mitotracker green stained cells produced significant changes in the fractal dimension after 3 hours with treatment of paclitaxel (Figure 15). While there are a number of other organelles that could experience structural changes due to apoptosis-related events soon after treatment, the link with the mitochondria images is compelling. The data from this study show that the nucleus and mitochondria are both in part responsible for changes in the fractal dimension observed during early phases of apoptosis.
Figure 15. Change in the fractal dimension observed in images of stained MCF-7 cell.
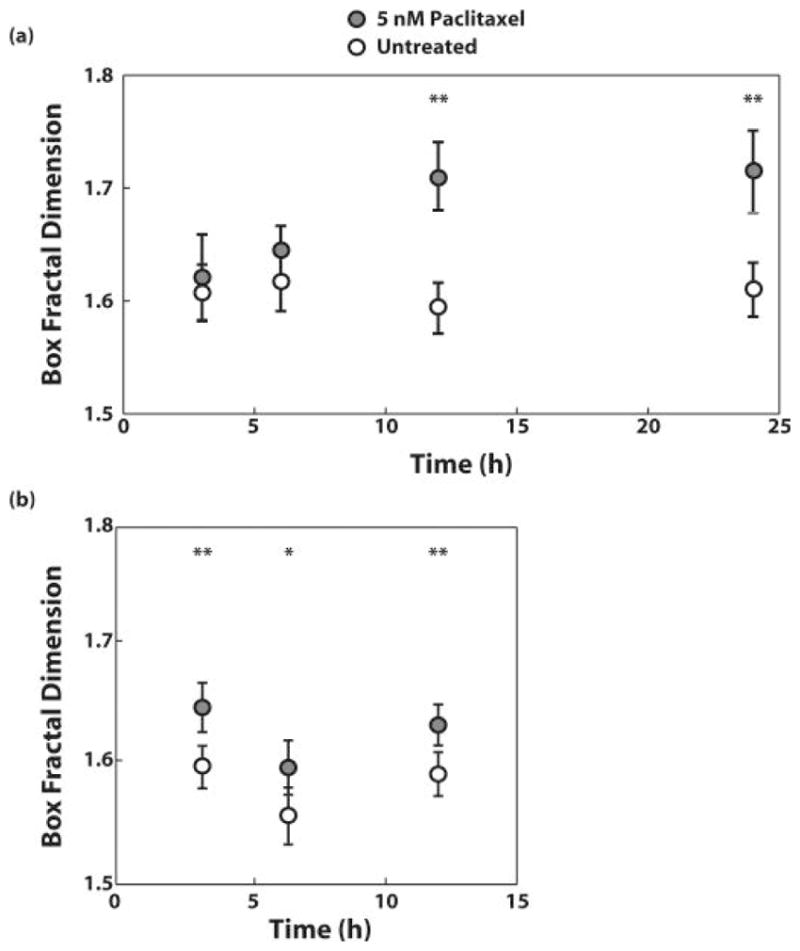
(a) nuclei and (b) mitochondria after treatment with 5 nM Paclitaxel for 3, 6, 12, and 24 hours or 3, 6, and 12 hours, respectively. Adapted from [45].
A noteworthy trend in this data that deserves discussion is the increase in fractal dimension during the first 3 hours, and then the slight but reproducible regression at 6 hours, followed by a steady increase through 24 hours. Although these trends were not found to be statistically significant, they support the possibility that two mechanisms are responsible for the observed changes. Significantly, treatment with 50 nM paclitaxel, which did not induce apoptosis, did cause the same early changes in fractal dimension but then reverted to nearly the same fractal dimension of control cells at later timepoints. This indicates that the early changes in fractal dimension are not clearly related to apoptosis. The data support the assertion that later changes in fractal dimension are related to nuclear fragmentation and apoptosis, but early changes arise from a different mechanism that is linked to changes in mitochondria morphology.
Finally, we note that the high degree of sensitivity in measuring fractal dimension was enabled by use of a T-matrix method of analysis, in contrast to Mie based analysis that assumes a spherical nucleus. By reducing the incompatibility between the true nucleus shape and the basis used for light scattering, the measurement of fractal dimension were less uncertain, producing a more refined assessment of subcellular structures.
Discussion
The experiments presented here show that a/LCI can be applied to study changes in nuclear morphology in the framework of dynamic cell biology experiments. In addition to producing accurate measurements, the a/LCI technique also offers the advantage of preserving the viability of cell samples after measurement while also greatly reducing the time required for data acquisition. The clinical a/LCI systems presented in the first portion of this chapter demonstrate that faster data acquisition rates can be realized with this approach. However, these can be accompanied by a nominal loss of sensitivity such that the time scale of a few minutes is a reasonable trade-off for the high degree of precision. The advances in analysis, including the use of the T-matrix method and its resulting reduction in uncertainty in fractal dimension measurements have led the way to new applications of a/LCI. Confirmation with image analysis remains the gold standard for assessing the validity and accuracy of a/LCI measurements. However, the repeated high degree of agreement seen between these two approaches, suggests that a/LCI based light scattering methods will continue to be a powerful non-invasive tool for basic cell biology research.
Conclusion
In conclusion, we have presented a/LCI as a noninvasive, high-throughput light scattering method for assessing cellular substructure. The main advantage of the technique is that useful structural information of cells and tissues is obtained without the need for acquiring a biopsy or fixing and staining samples. In this chapter, we have presented the various types of instrumentation used for a/LCI and several applications of the technology. In clinical applications, a/LCI has been advanced to evaluate nuclear morphology as a means to detect early stage cancer in esophageal epithelium. Results of in vivo clinical studies suggest that the approach is a viable method for this application. Further development of the approach will lead to diagnostic methods for other epithelial organ sites, such as colon and cervix. Applications of a/LCI to the study of in vitro cells shows that the technique can obtain highly accurate and precise measurements of subcellular structures. We have presented application of a/LCI to monitoring the dynamics of cell nuclei, in response to environmental stimuli such as modulation of osmotic pressure and nanotopographic structures. A more recent a/LCi study used measurements of the fractal dimension of subcellular structures to distinguish between cells treated with apoptosis-inducing drugs and control cells. Significantly, the changes were apparent very soon after treatment, suggesting a potential role in clinical evaluation of chemotherapeutic efficacy. These findings confirm that a/LCI light scattering measurements can be a useful tool in both basic research experiments and clinical diagnostics.
Figure 11.
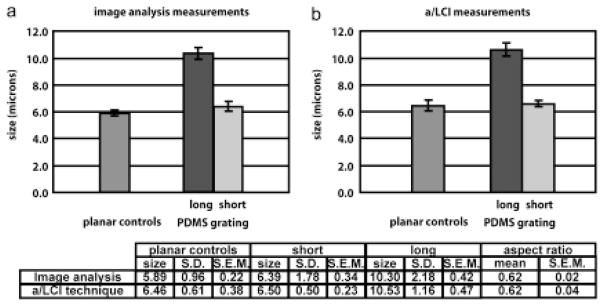
a/LCI study of murine macrophage cell nuclei aligned due to nanopatterened substrates. Comparison with imaging analysis (a) shows high accuracy of nuclear morphology measurements using a/LCI technique (b). Nuclear elongation is statistically significant (p < 0.01) for both a/LCI and image analysis measurements. Taken from [39].
Acknowledgments
This work was supported by the NIH (NCI R33-CA109907, NCI R21CA120128-01), the NSF (BES 03-48204), a grant from the Coulter Foundation and funding by Oncoscope, Inc. through a National Institutes of Health SBIR Phase II Grant. Adam Wax is founder and chairman of Oncoscope, Inc.
References
- 1.Drezek R, Dunn A, Richards-Kortum R. Light Scattering from Cells: Finite-Difference Time-Domain Simulations and Goniometric Measurements. Applied Optics. 1999;38:3651–3661. doi: 10.1364/ao.38.003651. [DOI] [PubMed] [Google Scholar]
- 2.Drezek R, Guillaud M, Collier T, Boiko I, Malpica A, Macaulay C, Follen M, Richards-Kortum R. Light scattering from cervical cells throughout neoplastic progression: influence of nuclear morphology, DNA content, and chromatin texture. Journal of Biomedical Optics. 2003;8(1):7–16. doi: 10.1117/1.1528950. [DOI] [PubMed] [Google Scholar]
- 3.Mourant JR, Canpolat M, Brocker C, Esponda-Ramos O, Johnson TM, Matanock A, Stetter K, Freyer JP. Light scattering from cells: the contribution of the nucleus and the effects of proliferative status. Journal of Biomedical Optics. 2000;5(2):131–137. doi: 10.1117/1.429979. [DOI] [PubMed] [Google Scholar]
- 4.Mourant JR, Johnson TM, Freyer JP. Characterizing mammalian cells and cell phantoms by polarized backscattering fiber-optic measurements. Applied Optics. 2001;40(28):5114–5123. doi: 10.1364/ao.40.005114. [DOI] [PubMed] [Google Scholar]
- 5.Perelman LT, Backman V, Wallace M, Zonios G, Manoharan R, Nusrat A, Shields S, Seiler M, Lima C, Hamano T, Itzkan I, Van Dam J, Crawford JM, Feld MS. Observation of periodic fine structure in reflectance from biological tissue: A new technique for measuring nuclear size distribution. Physical ReviewLetters. 1998;80(3):627–630. [Google Scholar]
- 6.Backman V, Wallace MB, Perelman LT, Arendt JT, Gurjar R, Muller MG, Zhang Q, Zonios G, Kline E, McGillican T, Shapshay S, Valdez T, Badizadegan K, Crawford JM, Fitzmaurice M, Kabani S, Levin HS, Seiler M, Dasari RR, Itzkan I, Van Dam J, Feld MS. Detection of preinvasive cancer cells. Nature. 2000;406(6791):35–36. doi: 10.1038/35017638. [DOI] [PubMed] [Google Scholar]
- 7.Georgakoudi I, Jacobson BC, Van Dam J, Backman V, Wallace MB, Muller MG, Zhang Q, Badizadegan K, Sun D, Thomas GA, Perelman LT, Feld MS. Fluorescence, reflectance, and light-scattering spectroscopy for evaluating dysplasia in patients with Barrett’s esophagus. Gastroenterology. 2001;120(7):1620–1629. doi: 10.1053/gast.2001.24842. [DOI] [PubMed] [Google Scholar]
- 8.Georgakoudi I, Sheets EE, Muller MG, Backman V, Crum CP, Badizadegan K, Dasari RR, Feld MS. Trimodal spectroscopy for the detection and characterization of cervical precancers in vivo. American Journal of Obstetrics and Gynecology. 2002;186(3):374–382. doi: 10.1067/mob.2002.121075. [DOI] [PubMed] [Google Scholar]
- 9.Wallace MB, Perelman LT, Backman V, Crawford JM, Fitzmaurice M, Seiler M, Badizadegan K, Shields SJ, Itzkan I, Dasari RR, Van Dam J, Feld MS. Endoscopic detection of dysplasia in patients with Barrett’s esophagus using light-scattering spectroscopy. Gastroenterology. 2000;119(3):677–682. doi: 10.1053/gast.2000.16511. [DOI] [PubMed] [Google Scholar]
- 10.Izatt JA, Kulkarni MD, Kobayashi K, Barton JK, Welch AJ. Optical coherence tomography for biodiagnostics. Opt & Phot News. 1997;8:41–47,65. [Google Scholar]
- 11.Wax A, Bali S, Thomas JE. Time-resolved phase-space distributions for light backscattered from it disordered medium. Physical Review Letters. 2000;85(1):66–69. doi: 10.1103/PhysRevLett.85.66. [DOI] [PubMed] [Google Scholar]
- 12.Pitris C, Jesser C, Boppart SA, Stamper D, Brezinski ME, Fujimoto JG. Feasibility of optical coherence tomography for high-resolution imaging of human gastrointestinal tract malignancies. Journal of Gastroenterology. 2000;35(2):87–92. doi: 10.1007/s005350050019. [DOI] [PubMed] [Google Scholar]
- 13.Tearney GJ, Brezinski ME, Bouma BE, Boppart SA, Pitris C, Southern JF, Fujimoto JG. In vivo endoscopic optical biopsy with optical coherence tomography. Science. 1997;276(5321):2037–2039. doi: 10.1126/science.276.5321.2037. [DOI] [PubMed] [Google Scholar]
- 14.Wax A, Yang CH, Backman V, Badizadegan K, Boone CW, Dasari RR, Feld MS. Cellular organization and substructure measured using angle-resolved low-coherence interferometry. Biophysical Journal. 2002;82(4):2256–2264. doi: 10.1016/S0006-3495(02)75571-9. [DOI] [PMC free article] [PubMed] [Google Scholar]
- 15.Pyhtila JW, Wax A. Polarization effects on scatterer sizing accuracy analyzed with frequency-domain angle-resolved low-coherence interferometry. Applied Optics. 2007;46(10):1735–1741. doi: 10.1364/ao.46.001735. [DOI] [PubMed] [Google Scholar]
- 16.Chalut KJ, Kresty LA, Pyhtila JW, Nines R, Baird M, Steele VE, Wax A. In situ assessment of intraepithelial neoplasia in hamster trachea epithelium using angle-resolved low-coherence interferometry. Cancer Epidemiology Biomarkers & Prevention. 2007;16(2):223–227. doi: 10.1158/1055-9965.EPI-06-0418. [DOI] [PubMed] [Google Scholar]
- 17.Wax A, Pyhtila JW, Graf RN, Nines R, Boone CW, Dasari RR, Feld MS, Steele VE, Stoner GD. Prospective grading of neoplastic change in rat esophagus epithelium using angle-resolvedlow-coherence interferometry. Journal Of Biomedical Optics. 2005;10(5):051604. doi: 10.1117/1.2102767. [DOI] [PubMed] [Google Scholar]
- 18.Wax A, Yang CH, Muller MG, Nines R, Boone CW, Steele VE, Stoner GD, Dasari RR, Feld MS. In situ detection of neoplastic transformation and chemopreventive effects in rat esophagus epithelium using angle-resolved low-coherence interferometry. Cancer Research. 2003;63(13):3556–3559. [PubMed] [Google Scholar]
- 19.Pyhtila JW, Graf RN, Wax A. Determining nuclear morphology using an improved angle-resolved low coherence interferometry system. Optics Express. 2003;11(25):3473–3484. doi: 10.1364/oe.11.003473. [DOI] [PubMed] [Google Scholar]
- 20.Wax A, Yang C, Muller MG, Nines R, Boone CW, Steele VE, Stoner GD, Dasari RR, Feld MS. In situ detection of neoplastic transformation and chemopreventive effects in rat esophagus epithelium using angle-resolved low-coherence interferometry. Cancer Research. 2003;63:3556–3559. [PubMed] [Google Scholar]
- 21.Wax A, Pyhtila JW, Graf RN, Nines R, Boone CW, Dasari RR, Feld MS, Steele VE, Stoner GD. Prospective grading of neoplastic change in rat esophagus epithelium using angle-resolved low-coherence interferometry. Journal of Biomedical Optics. 2005;10(5) doi: 10.1117/1.2102767. [DOI] [PubMed] [Google Scholar]
- 22.Yang CH, Wax A, Dasari RR, Feld MS. Phase-dispersion optical tomography. Optics Letters. 2001;26(10):686–688. doi: 10.1364/ol.26.000686. [DOI] [PubMed] [Google Scholar]
- 23.Choma MA, Sarunic MV, Yang CH, Izatt JA. Sensitivity advantage of swept source and Fourier domain optical coherence tomography. Optics Express. 2003;11(18):2183–2189. doi: 10.1364/oe.11.002183. [DOI] [PubMed] [Google Scholar]
- 24.de Boer JF, Cense B, Park BH, Pierce MC, Tearney GJ, Bouma BE. Improved signal-to-noise ratio in spectral-domain compared with time-domain optical coherence tomography. Optics Letters. 2003;28(21):2067–2069. doi: 10.1364/ol.28.002067. [DOI] [PubMed] [Google Scholar]
- 25.Leitgeb R, Hitzenberger CK, Fercher AF. Performance of fourier domain vs. time domain optical coherence tomography. Optics Express. 2003;11(8):889–894. doi: 10.1364/oe.11.000889. [DOI] [PubMed] [Google Scholar]
- 26.Pyhtila JW, Wax A. Rapid, depth-resolved light scattering measurements using Fourier domain, angle-resolved low coherence interferometry. Optics Express. 2004;12(25):6178–6183. doi: 10.1364/opex.12.006178. [DOI] [PMC free article] [PubMed] [Google Scholar]
- 27.Pyhtila JW, Boyer JD, Chalut KJ, Wax A. Fourier-domain angle-resolved low coherence interferometry through an endoscopic fiber bundle for light-scattering spectroscopy. Optics Letters. 2006;31(6):772–774. doi: 10.1364/ol.31.000772. [DOI] [PubMed] [Google Scholar]
- 28.Zhu Y, Terry NG, Woosley JT, Shaheen NJ, Wax A. Design and validation of an angle-resolved low-coherence interferometry fiber probe for in vivo clinical measurements of depth-resolved nuclear morphology. Journal of Biomedical Optics. 2011;16(1):011003–10. doi: 10.1117/1.3520130. [DOI] [PMC free article] [PubMed] [Google Scholar]
- 29.Brown WJ, Pyhtila JW, Terry NG, Chalut KJ, D’Amico TA, Sporn TA, Obando JV, Wax A. Review and recent development of angle-resolved low-coherence interferometry for detection of precancerous cells in human esophageal epithelium. IEEE Journal of Selected Topics in Quantum Electronics. 2008;14(1):88–97. [Google Scholar]
- 30.Brown WJ, PJW, Terry NG, Chalut KJ, D’Amico T, Sporn TA, Obando JV, Wax A. Review and recent development of angle-resolved low coherence interferometry for detection of pre-cancerous cells in human esophageal epithelium. IEEE Journal of Selected Topics in Quantum Electronics. 2008;14:88–97. [Google Scholar]
- 31.Mishchenko MI, Travis LD, Hovenier JW. Light scattering by nonspherical particles: theory, measurements and applications. 10. San Diego; London: Academic; 2000. p. xxx.p. 690. p. of plates. [Google Scholar]
- 32.Teixera J. Experimental methods for studying fractal aggregates. In: Stanley HE, Ostrowsky N, editors. On Growth and Form, Fractal and Non-FractalPatterns in Physics. 1986. pp. 145–162. [Google Scholar]
- 33.Falk GW. Barrett’s esophagus. Gastroenterology. 2002;122(6):1569–1591. doi: 10.1053/gast.2002.33427. [DOI] [PubMed] [Google Scholar]
- 34.Spechler SJ. Barrett’s esophagus and esophageal adenocarcinoma: pathogenesis, diagnosis, and therapy. Medical Clinics of North America. 2002;86(6):1423. doi: 10.1016/s0025-7125(02)00082-2. [DOI] [PubMed] [Google Scholar]
- 35.Pyhtila JW, Chalut KJ, Boyer JD, Keener J, D’Amico T, Gottfried M, Gress F, Wax A. In situ detection of nuclear atypia in Barrett’s esophagus by using angle-resolved low-coherence interferometry. Gastrointestinal Endoscopy. 2007;65(3):487–491. doi: 10.1016/j.gie.2006.10.016. [DOI] [PubMed] [Google Scholar]
- 36.Terry NG, Zhu Y, Rinehart MT, Brown WJ, Gebhart SC, Bright S, Carretta E, Ziefle CG, Panjehpour M, Galanko J, Madanick RD, Dellon ES, Trembath D, Bennett A, Goldblum JR, Overholt BF, Woosley JT, Shaheen NJ, Wax A. Detection of Dysplasia in Barrett’s Esophagus With In Vivo Depth-Resolved Nuclear Morphology Measurements. Gastroenterology. 2011;140(1):42–50. doi: 10.1053/j.gastro.2010.09.008. [DOI] [PMC free article] [PubMed] [Google Scholar]
- 37.Guilak F, Erickson GR, Ting-Beall HP. The Effects of Osmotic Stress on the Viscoelastic and Physical Properties of Articular Chondrocytes. Biophysical Journal. 2002;82(2):720–727. doi: 10.1016/S0006-3495(02)75434-9. [DOI] [PMC free article] [PubMed] [Google Scholar]
- 38.Guilak F, Ratcliffe A, Mow VC. Chondrocyte deformation and local tissue strain in articular cartilage: A confocal microscopy study. Journal of Orthopaedic Research. 1995;13(3):410–421. doi: 10.1002/jor.1100130315. [DOI] [PubMed] [Google Scholar]
- 39.Chalut KJ, Chen S, Finan JD, Giacomelli MG, Guilak F, Leong KW, Wax A. Label-Free, High-Throughput Measurements of Dynamic Changes in Cell Nuclei Using Angle-Resolved Low Coherence Interferometry. Biophysical Journal. 2008;94(12):4948–4956. doi: 10.1529/biophysj.107.124107. [DOI] [PMC free article] [PubMed] [Google Scholar]
- 40.Yim EKF, Reano RM, Pang SW, Yee AF, Chen CS, Leong KW. Nanopattern-induced changes in morphology and motility of smooth muscle cells. Biomaterials. 2005;26(26):5405–5413. doi: 10.1016/j.biomaterials.2005.01.058. [DOI] [PMC free article] [PubMed] [Google Scholar]
- 41.Yim EKF, Pang SW, Leong KW. Synthetic nanostructures inducing differentiation of human mesenchymal stem cells into neuronal lineage. Experimental Cell Research. 2007;313(9):1820–1829. doi: 10.1016/j.yexcr.2007.02.031. [DOI] [PMC free article] [PubMed] [Google Scholar]
- 42.Chalut KJ, Giacomelli MG, Wax A. Application of Mie theory to assess structure of spheroidal scattering in backscattering geometries. Journal of the Optical Society of America a-Optics Image Science and Vision. 2008;25(8):1866–1874. doi: 10.1364/josaa.25.001866. [DOI] [PMC free article] [PubMed] [Google Scholar]
- 43.Mishchenko MI, Travis LD, Mackowski DW. T-matrix computations of light scattering by nonspherical particles: A review. Journal of Quantitative Spectroscopy and Radiative Transfer. 1996;55(5):535–575. [Google Scholar]
- 44.Giacomelli MG, Chalut KJ, Ostrander JH, Wax A. Application of the T-matrix method to determine the structure of spheroidal cell nuclei with angle-resolved light scattering. Optics Letters. 2008;33(21):2452–2454. doi: 10.1364/ol.33.002452. [DOI] [PMC free article] [PubMed] [Google Scholar]
- 45.Chalut KJ, Ostrander JH, Giacomelli MG, Wax A. Light Scattering Measurements of Subcellular Structure Provide Noninvasive Early Detection of Chemotherapy-Induced Apoptosis. Cancer Research. 2009 doi: 10.1158/0008-5472.CAN-08-3079. 0008-5472.CAN-08-3079. [DOI] [PMC free article] [PubMed] [Google Scholar]
- 46.Boustany NN, Drezek R, Thakor NV. Calcium-induced alterations in mitochondrial morphology quantified in situ with optical scatter imaging. Biophysical Journal. 2002;83(3):1691–1700. doi: 10.1016/S0006-3495(02)73937-4. [DOI] [PMC free article] [PubMed] [Google Scholar]
- 47.Wilson JD, Foster TH. Mie theory interpretations of light scattering from intact cells. Optics Letters. 2005;30(18):2442–2444. doi: 10.1364/ol.30.002442. [DOI] [PubMed] [Google Scholar]


