
Fig. 7.
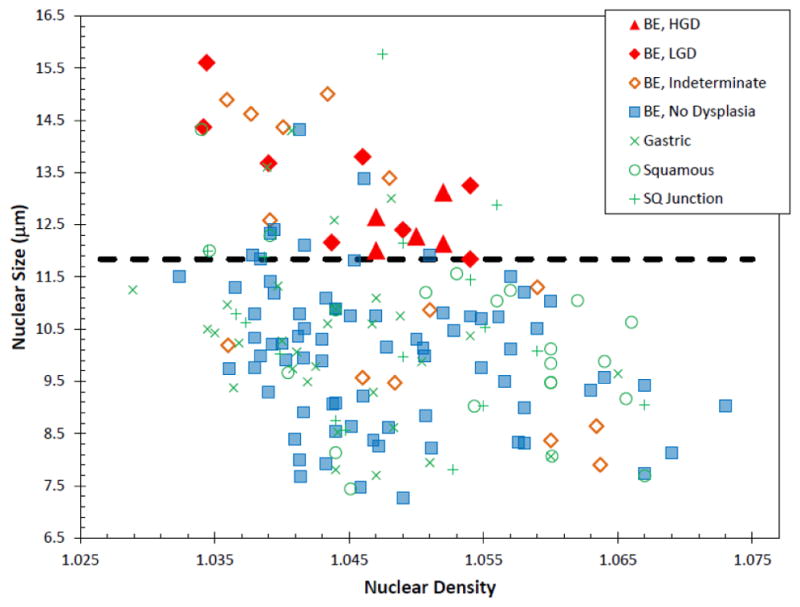
In vivo basal layer scatter plot for BE study. Each point represents a single optical biopsy and is color-coded by its pathological diagnosis. Dotted black line represents decision line. Taken from Ref. [36]
Official websites use .gov
A
.gov website belongs to an official
government organization in the United States.
Secure .gov websites use HTTPS
A lock (
) or https:// means you've safely
connected to the .gov website. Share sensitive
information only on official, secure websites.
In vivo basal layer scatter plot for BE study. Each point represents a single optical biopsy and is color-coded by its pathological diagnosis. Dotted black line represents decision line. Taken from Ref. [36]