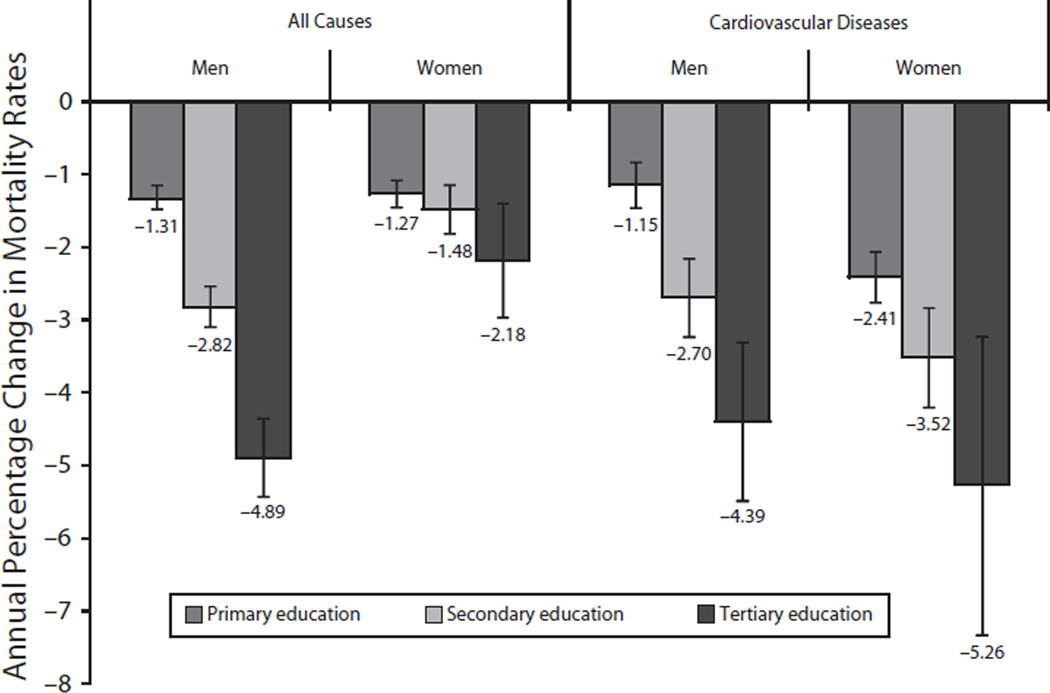
FIGURE 3.
Annual percentage change in mortality rates at ages 30–64 years according to educational level: Colombia, 1998–2007.
Note. Primary = elementary or primary school; secondary = high-school diploma; tertiary = postsecondary education after high school including college and university. Annual percent change comes from separate Poisson regression models for men and women that control for age, year, and education.

