
Figure 4.
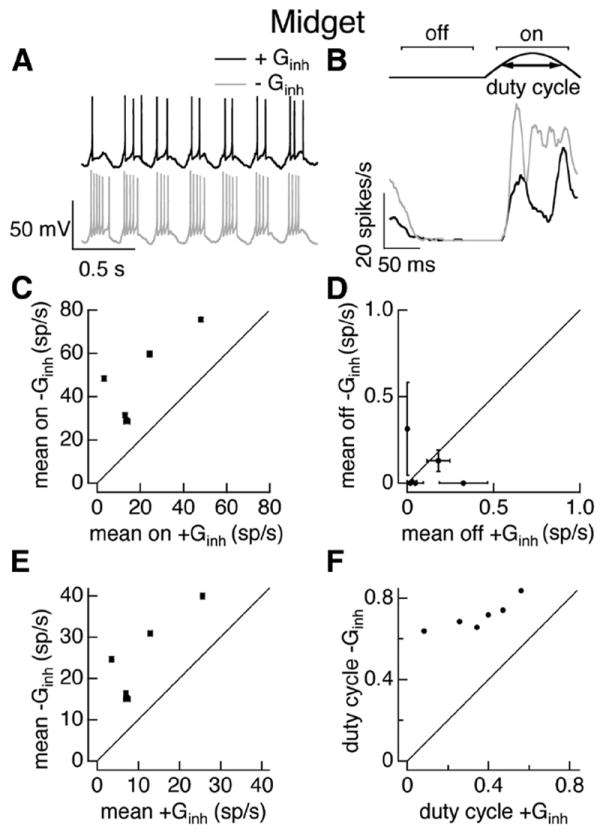
Inhibitory input strongly regulates midget cell responses to full-field sinusoidal stimuli. A, Example voltage responses of an On midget cell during a dynamic clamp experiment. Top, Response to injection of currents corresponding to excitatory and inhibitory conductances elicited in a different cell by 100% contrast full-field sinusoidal stimuli. Bottom, Response to excitatory conductance alone. B, Average firing rate for one cycle of the conductances corresponding to the sinusoidal stimulus. Top shows schematic of firing rate and measures used to quantify impact of inhibition. C, Mean firing rate during the responsive phase of the stimulus in the presence and absence of the inhibitory conductance.D, Mean firing rate during the nonresponsive phase of the stimulus in the presence and absence of the inhibitory conductance. E, Mean firing rate in the presence and absence of the inhibitory conductance. F, Duty cycle (see Materials and Methods) in the presence and absence of the inhibitory conductance. Error bars in C–E are SEM computed across 10–25 dynamic clamp trials.