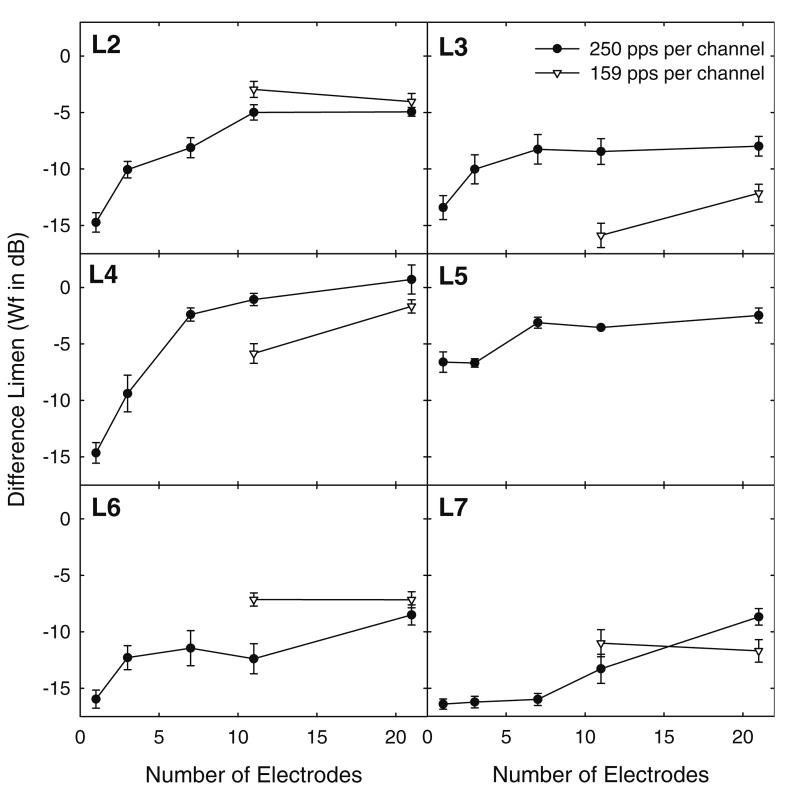
FIG. 1.
The electric profile difference limen (DL) in Weber fractions (Wf; in dB) is shown as a function of the number of stimulated electrodes for each individual listener. Data are shown for 250 and 159 pulses per second per channel. Error bars show 1 standard error. Only six listeners participated.

