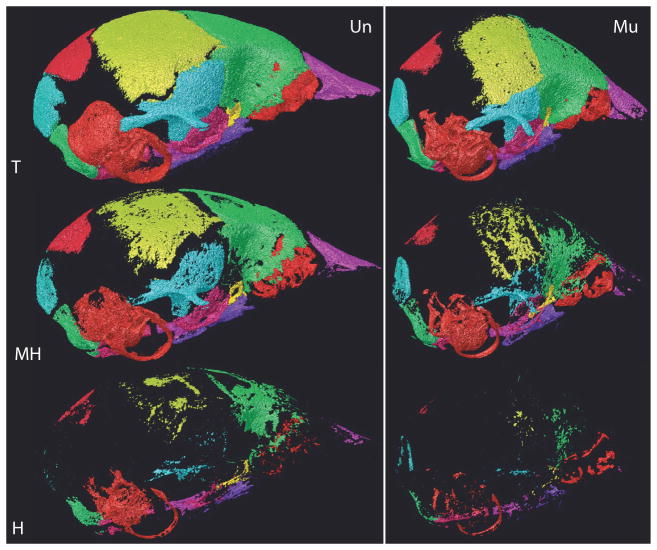
Fig. 2.
Comparison of bone volume categories between genotypes. Individual bone surface reconstructions of total (T), medium-high (MH), and high (H) density bone volume voxels for an Fgfr2+/Y394Cmutant (Mu) and an unaffected littermate (Un) at P8. H voxels are a subset of MH, which are a subset of T.

