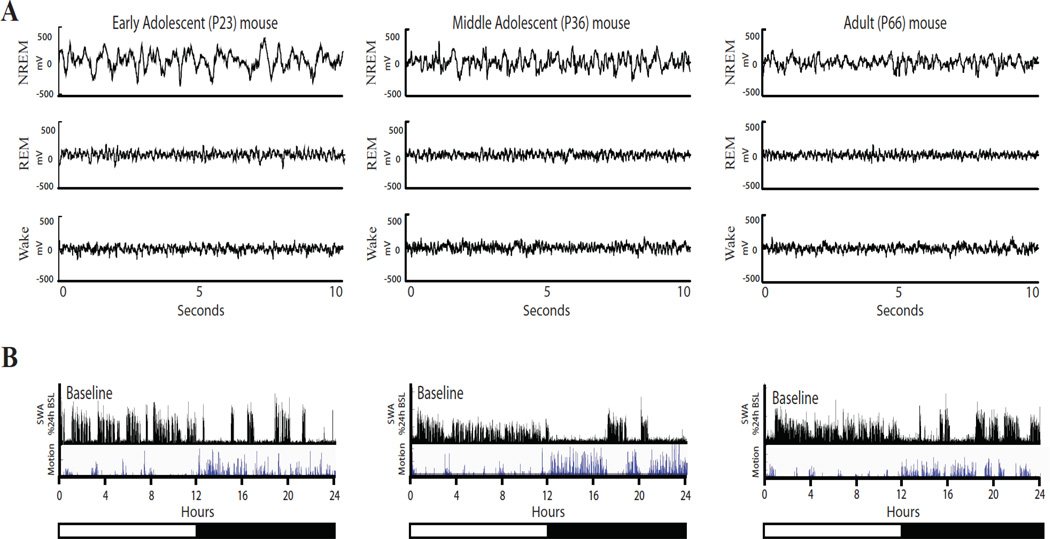
Figure 1.
Representative examples of EEG traces in adolescent and adult mice. (A) EEG traces (10 s) for NREM sleep, REM sleep, and wake in an early adolescent (P23), middle adolescent (P36) and adult (P66) mouse are shown. (B) The bottom panels show the time course of NREM slow wave activity (SWA, expressed as % of 24-h mean SWA, 4-s epochs) and locomotor activity (video-based motion detection, 4-s epochs) for the same animals during 24 h of baseline. Motion is measured in arbitrary units and values cannot be compared across animals.

