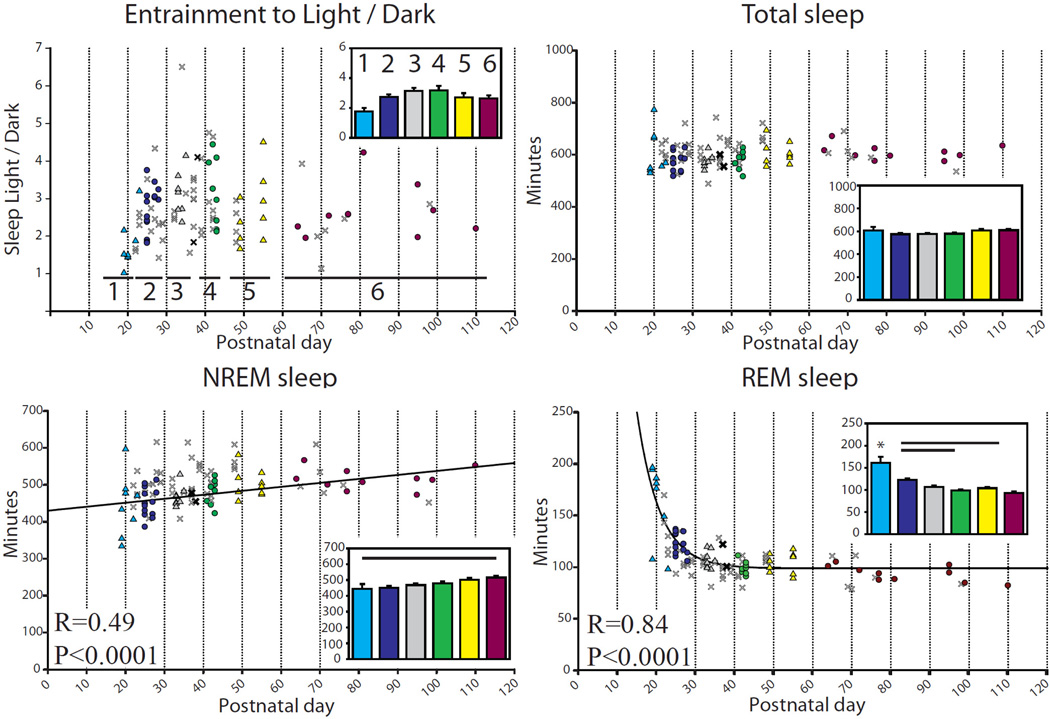
Figure 2.
Daily sleep and wake amounts (min/24 h) during baseline for each mouse. In all figures, symbols show values for each mouse, with P and R corresponding to the regression line computed from all animals except those denoted by a faint “X”. Insets depict group means ± SEM, with bars indicating significant differences between groups, and asterisks indicating one group different from all others (p < 0.05, Tukey’s HSD). Age groups in all figures: 1 ≤ P25; 2 = P26–29; 3 = P34–36; 4 = P41–44; 5 = P50–56; 6 ≥ P60. Age ranges correspond to those chosen for the acute sleep deprivation experiment. The bold “X” are baseline days, i.e., the days just before the sleep deprivation day, and are included in the regression analysis. The faint X denotes additional scored days from the same mice that did not qualify as “baseline” (i.e., they occurred >1 day before sleep deprivation, or at least 3 days afterwards). The x days are included for reference only but were not used for the ANOVA. In this figure, NREM sleep is fit to age with a linear relationship, f = y0 + a × x, (f = min NREM, y0 = 429.98, a = 1.08, x = Postnatal day) while REM sleep is fit to age with an exponential decay, f = y0 + a × exp(−b × x), (f = min REM, y0 = 98.80, a = 2012.99, b = 0.17, x = Postnatal day).

