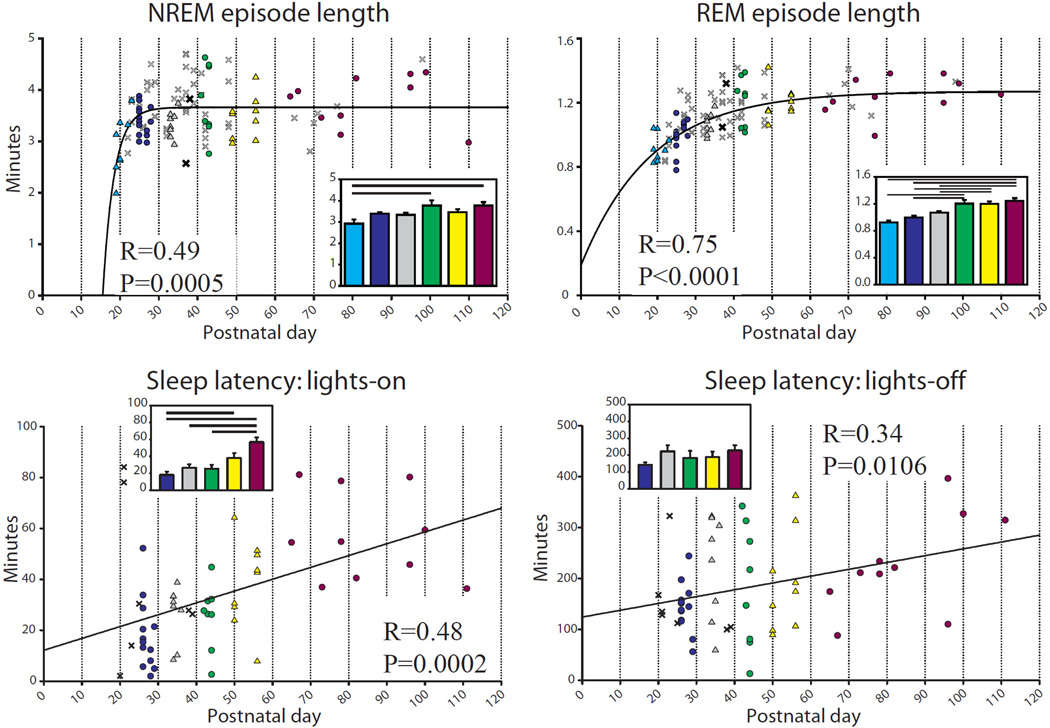
Figure 3.
Episode duration and sleep latency during baseline. For episode length, p and R are from the regression for an exponential equation increasing to a maximum, f = y0 + a × [1 − exp(−b × x)] (top left: f = min, y0 = −407.10, a = 410.67, b = 0.32, x = Postnatal day), (top right: f = min, y0 = 0.19, a = 1.08, b = 0.054, x = Postnatal day); for sleep latency, p and R are from the linear regression (f = y0 + a × x) (bottom left: f = min, y0 = 12.12, a = 0.47, x = Postnatal day; bottom right: f = min, y0 = 120.45, a = 1.41, x = Postnatal day).

