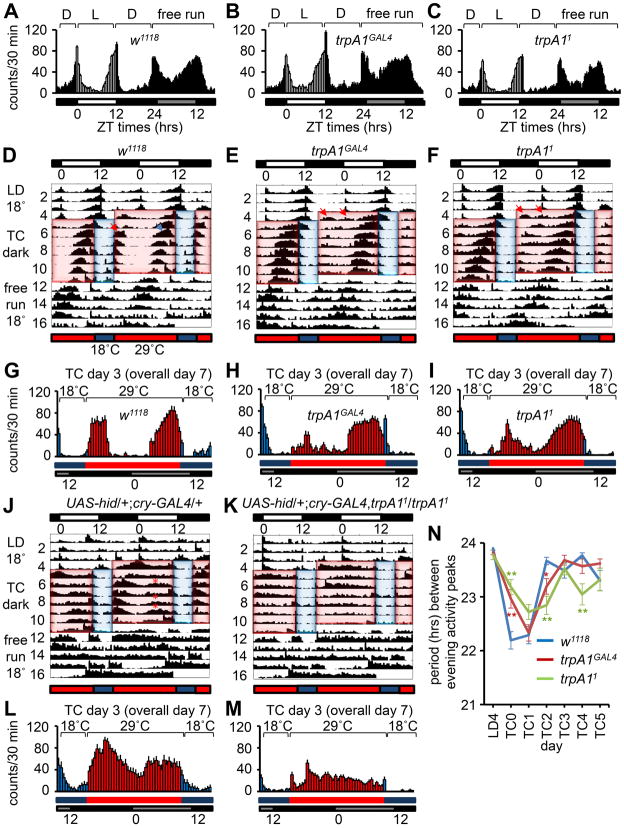
Figure 1.
Actograms using LD and TC entrainment. A – C, Average activities of male flies on day 4 under LD conditions (12 h light/12 h dark cycles at 25°C), and day 1 under constant darkness (free run at 25°C). ZT times are indicated. The white, black and grey bars represent day, night and subjective day, respectively. A, w1118. B, trpA1GAL4. C, trpA11. D,E,F,J,K, Average normalized activities for the indicated genotypes. Flies were maintained for four days at 18°C under 12 h light/12 h dark cycles (LD 18°C) and entrained for seven days under constant darkness using 18 h (29°C) thermophases/6 h (18°C) cryophases (TC dark). The flies were then kept at a constant temperature (18°C) in the dark (free run 18°C). Except for overall days 1 and 17, the daily activities are presented on two lines. The top white and black bars indicate LD cycles. The bottom red and blue bars indicate TC cycles. The red and blue shading indicates warm and cool phases, respectively. D, w1118. The red and blue arrows on overall day 7 (TC day 3) indicate examples of morning and evening activities, respectively. E, trpA1GAL4. F, trpA11. The two arrows on overall day 5 (TC day 1) indicate small double peaks. G – I, Activities from TC day 3 (overall day 7) from D, E and F, respectively. G, w1118. H, trpA1GAL4. I, trpA11. J, UAS-hid/+;cry-GAL4/+. Asterisks indicate smaller and broader evening activities. K, UAS-hid/+;cry-GAL4,trpA11/trpA11. L,M, Activities from TC day 3 (overall day 7) from J and K, respectively. N, Periods between evening activity peaks from D, E and F. The error bars represent SEMs. The asterisks indicate significant differences from wild-type (*p<0.05, ** p<0.01) based on ANOVA and the Scheffé post-hoc test.

