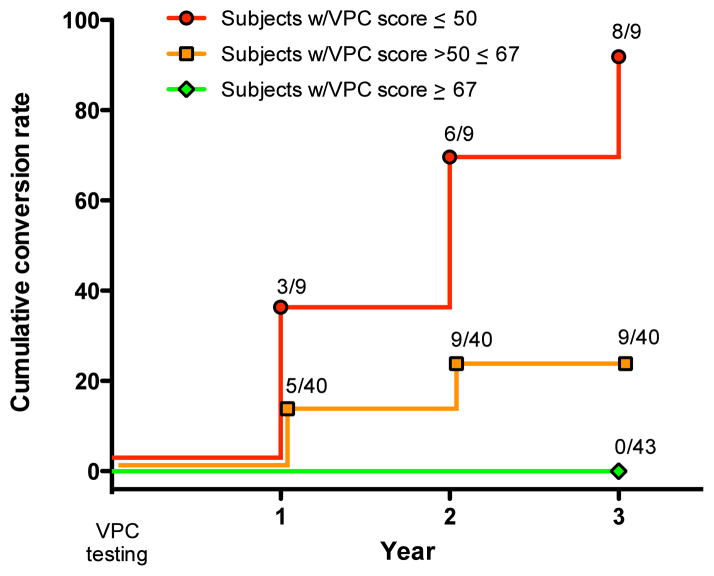
Fig. 2. Cumulative proportion of subjects whose diagnosis changed across time based on their VPC 2-min delay score.
The colors delineate three ranges of scores: Red (<50% novelty preference); Orange (novelty preference between 50% and 67%); Green (>67% novelty preference). The left axis indicates percent of subjects whose diagnosis converted from aMCI to AD (n=13), or from CON to aMCI (n=4; at the time of writing, one of these four subjects has converted to AD). Log-rank p<0.001. AD indicates Alzheimer’s disease; aMCI, amnestic mild cognitive impairment; CON, control; VPC, Visual Paired Comparison.

