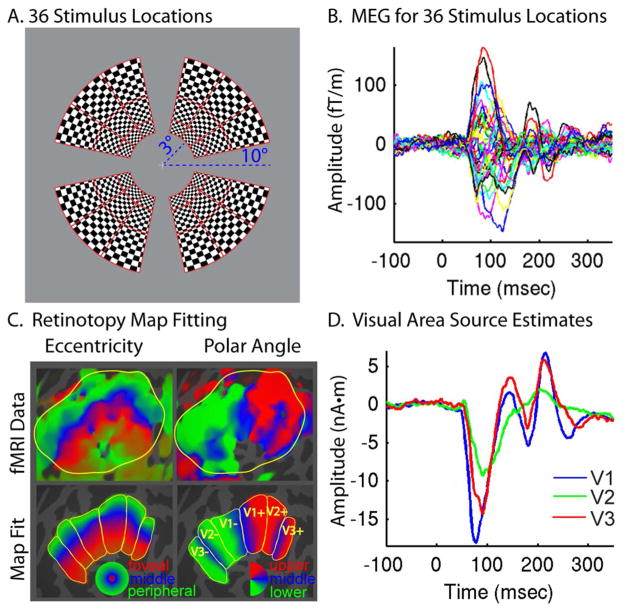
Figure 1.
Retinotopy constrained source estimation. A. Checkerboard stimuli were displayed at one of 36 visual field locations. B. MEG was used to measure VERs in an individual subject, and time courses for each location are shown for a selected mid-line occipital gradiometer. C. A map template was fitted to fMRI retinotopy data to identify cortical patches for each stimulus location and construct retinotopy constrained forward models. D. Source estimates were generated for V1, V2, and V3, simultaneously constrained by all 36 stimulus locations.

