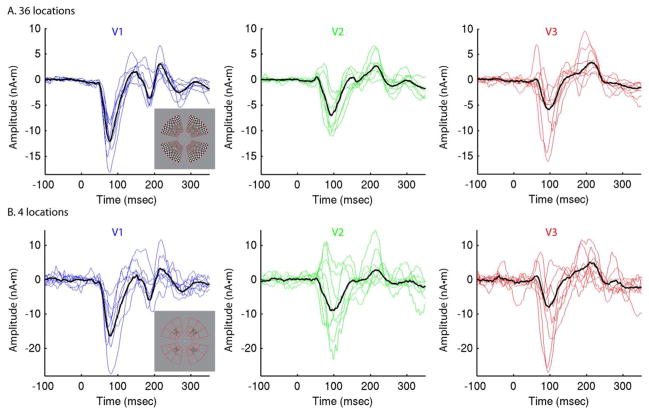
Figure 2.
Group-constrained RCSE. RCSE time courses calculated from responses to high contrast (95%) stimuli for 8 subjects are shown in blue (V1), green (V2), or red (V3), with group-RCSE solutions superimposed in black. A. RCSE solutions with 36 stimulus locations. B. RCSE with 4 stimulus locations. Locations of the 4 stimuli were at 5.3° visual angle and 45° from the horizontal and vertical meridians, as indicated by the inset image of stimulus locations.

