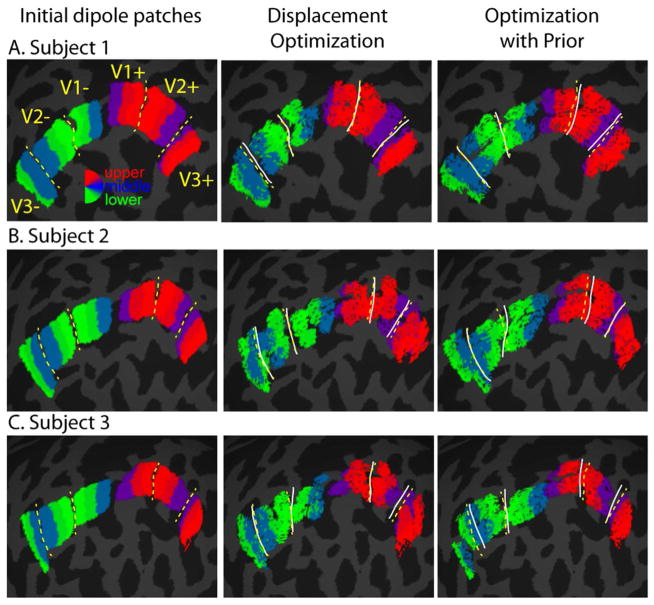
Figure 6.
Cortical patch dipoles before and after optimization constrained by prior for three representative subjects (A–C). Colors for each cortical patch (excluding those with weights < 0.2 relative to maximum) correspond to the central polar angle of the matching stimulus, using the same color scheme as in Fig. 1C. The small holes in the patches after optimization are related to how patches were displaced across the cortical surface. For each vertex in the original patch, a single vertex was chosen closest to the original location plus the 2-dimensional displacement. Dashed, yellow lines represent approximate, manually-drawn borders between V1, V2, and V3. Solid white lines represent approximate, manually-drawn borders after optimization.

