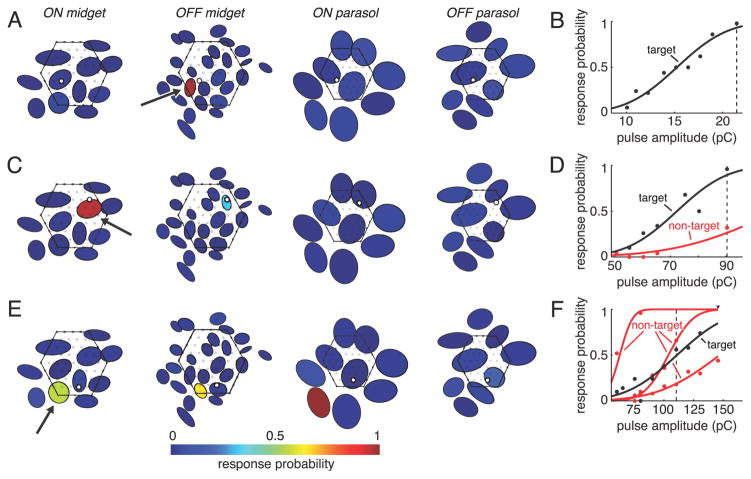
Figure 6.
Examples of cell selectivity in electrical activation. A, C, and E, Response probability of each cell in a single recording for a specific stimulation electrode and pulse amplitude. Cells are represented by elliptical fits to their visual receptive fields (Fig. 1), and each target cell is marked with an arrow. Fill colors indicate response probabilities. Mosaics of receptive fields are separated and midget mosaics are enlarged 25% relative to parasol mosaics for clarity. The position of each stimulation electrode is depicted as an open black circle, and non-stimulation electrodes are shown as filled gray circles. The outline of the array is indicated with a hexagon. B, D, and F, Response curves of activated cells. Vertical dashed lines indicate pulse amplitudes plotted in A, C, and E. Nonzero response probabilities for cells in A, C, and E not represented in B, D, and F were ≤0.08 and were consistent with spontaneous activity (see Materials and Methods).

