
Figure 3. Reversible events mirror repetitive fusion of single vesicle.
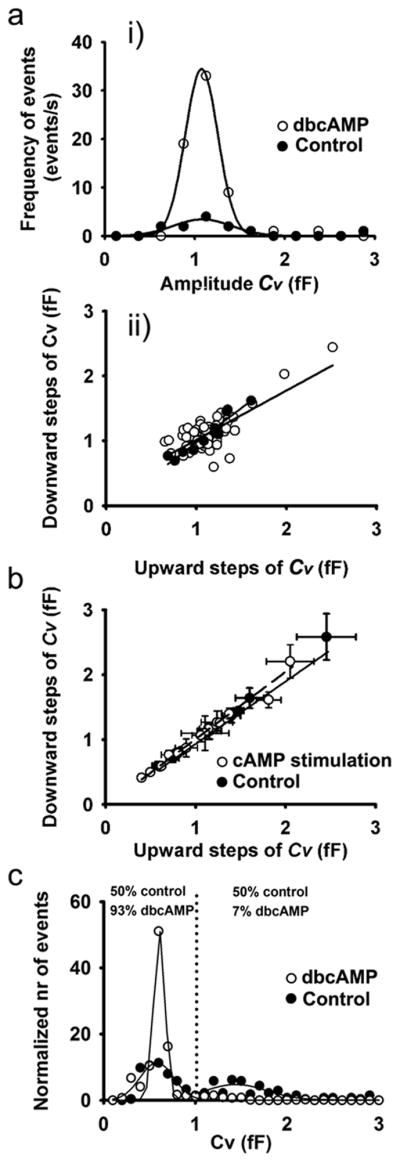
(a)(i) The distributions of vesicle membrane capacitance (Cv) amplitudes of reversible events from a representative patch, before and after the stimulation with dbcAMP, were similar. Lines show fitted Gaussian curves with means of 1.09 ± 0.05 fF (control, correlation coefficient r=0.92; n=11 events) and 1.08 ± 0.01 fF (dbcAMP, r=0.99; n=64 events), respectively. (ii) The relationship between amplitudes of the downward and the preceding upward Cv steps of reversible events: the regression line represents the best fit with parameters: y (Cv amplitude of the downward step)=(1.0 ± 0.1) × x (Cv amplitude of the upward step) + (−0.1 ± 0.1) (r=0.95, n=11 events) before stimulation and the regression line y (Cv amplitude of the downward step)=(0.8 ± 0.1) × x (Cv amplitude of the upward step) + (0.26 ± 0.10) (r=0.76, n=64 events) after the stimulation (open circles). The slopes of both regression lines were similar (p=0.2). (b) The relationship between the average Cv amplitudes of downward vs. upward discrete steps of reversible events in distinct membrane patches before and after the addition of cAMP-increasing agents. The solid line represents linear fit of the controls: y (the average Cv amplitudes of down-ward steps)=(0.97 ± 0.04) × x (the average Cv amplitudes of upward steps) + (−0.03 ± 0.15) (r=0.99, n=9 cells) and the dashed line represents linear fit to the data obtained after the addition of cAMP-increasing agents: y (the average Cv amplitudes of upward steps)=(1.04 ± 0.02) × x (the average Cv amplitudes of downward steps) + (−0.03 ± 0.05) (r= 0.99, n=16 cells). The slopes of both regression lines were similar (p=0.3). Values are means ± s.e.m. (c) Distribution of Cv amplitudes of all events in control conditions shows two population best fitted with Gaussian curves with means: 0.58 ± 0.01 fF (r=0.82) and 1.44 ± 0.02 fF (r=0.80), each corresponding to 50 percent of all events in control conditions. After dbcAMP, we only observed one population best fitted with Gaussian curve with mean 0.61 ± 0.01 fF (r=0.99) that represents 93 percent of all events after dbcAMP.