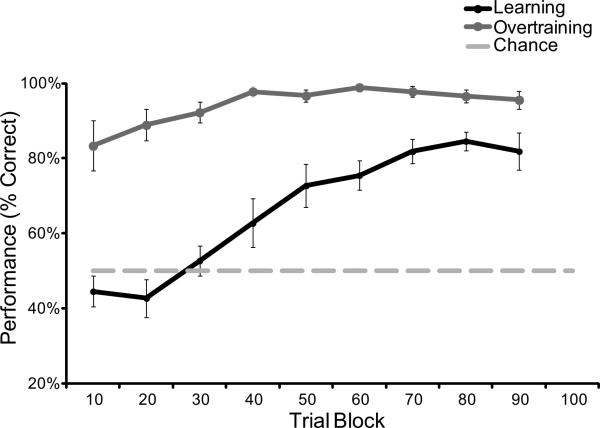
Figure 4. Performance in Learning and Overtraining.
The learning curve represents the average performance of 11 rats within bins of 10 trials. The extended training curve reflects performance of 9 of the same 11 rats across 9 sessions. Performance did increase significantly during overtraining (Repeated measures ANOVA: F(8,64) = 3.217; p = 0.004; n = 9), but was significantly different from learning (Repeated measures ANOVA interaction: F(8,144) = 5.687; p < 0.001) Error bars reflect 1+/- S.E.M.

