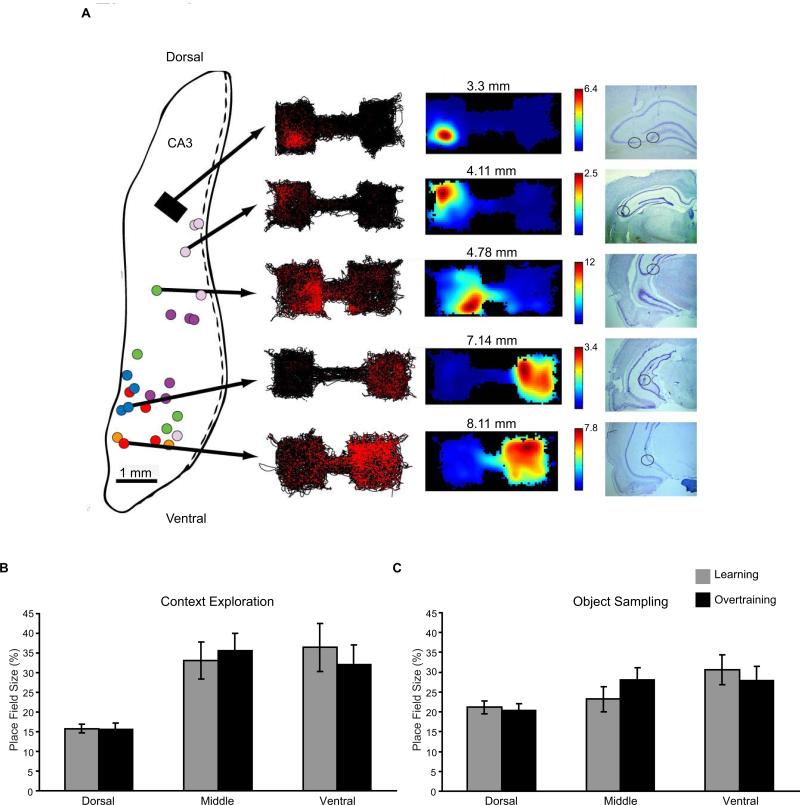
Figure 5. Place Field Sizes in Learning and with Overtraining.
A) Tetrode locations and example spatial firing patterns and place fields. Tetrodes in the 5 rats from our previous study (Komorowski et al., 2009) were often too close together to determine their exact location, and therefore are represented by grey boxes. Tetrode locations for the 6 new rats are depicted in colored circles with locations for each rat in the same color on a 2-D flattened map of hippocampus (Swanson et al., 1978). To the right shows the spatial firing plots for 5 cells selected from different recording depths in rats during the extended training condition. On the left is the rat's path (black lines) along with red dots indicating the location where spikes occurred. To the right are normalized spatial firing rate maps generated from the spiking data. Histological sections show the tetrode location for each example cell. B) Place field size measured during the context exploration period. Bars show average place field size (± S.E.) as a percentage of the context for neurons in dorsal, middle, and ventral CA3. C) Same place field measures for the object sampling period.

