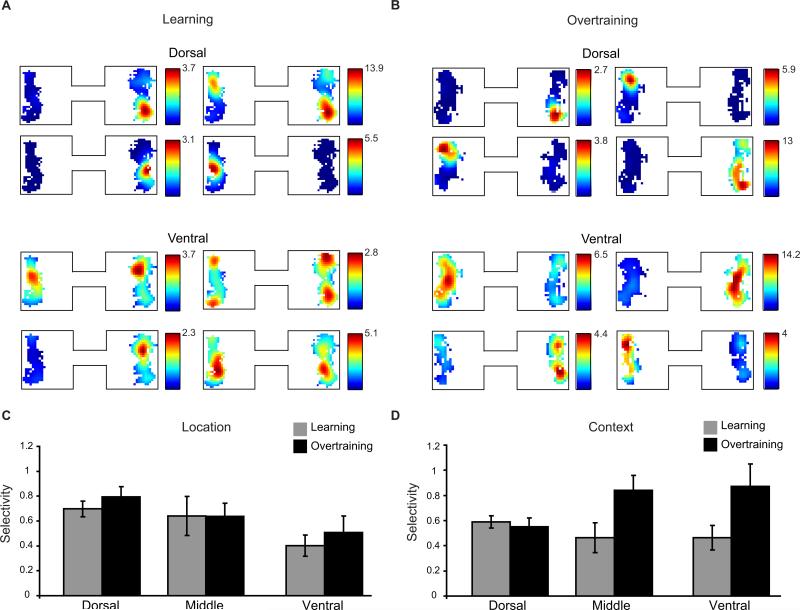
Figure 6. Location and Context Selectivity During Object Sampling.
Normalized spatial firing rate maps for the object sampling period in the learning session (A) and in overtraining sessions (B). Each set of plots represents the spatial firing patterns of four example neurons. C) Average (± S.E.) single cell location selectivity during object sampling in learning and overtraining sessions. Location selectivity was measured as the difference in z-score normalized firing rate between a cell's preferred object location (location with the maximum firing rate) and the other location, within the same context. D) Average (± S.E.) single cell context selectivity measured as the difference in z-score normalized firing rate between a cell's preferred object context (context with the maximum firing rate across both locations) and the other context.

