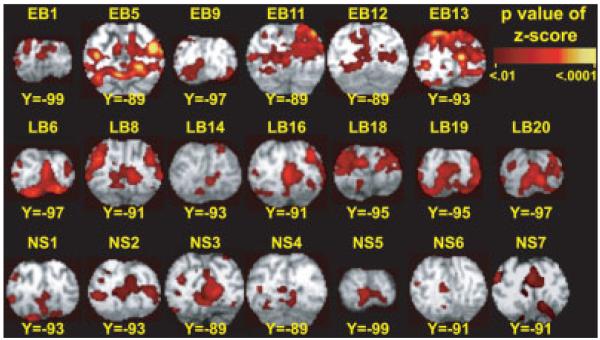
Figure 3.
Distribution of increased activity is shown for a posterior occipital portion of V1. Results are shown from individuals with suprathreshold responses. Images are multiple-comparison corrected cross-correlation z-score maps (minimum z = 4, two face-connected voxels) overlaid onto atlas transformed [Talairach and Tournoux, 1988] structural anatomy for each individual. Labels cross-reference to demographic characteristics listed in Table I (early blind, EB; late blind, LB; and sighted, NS).

