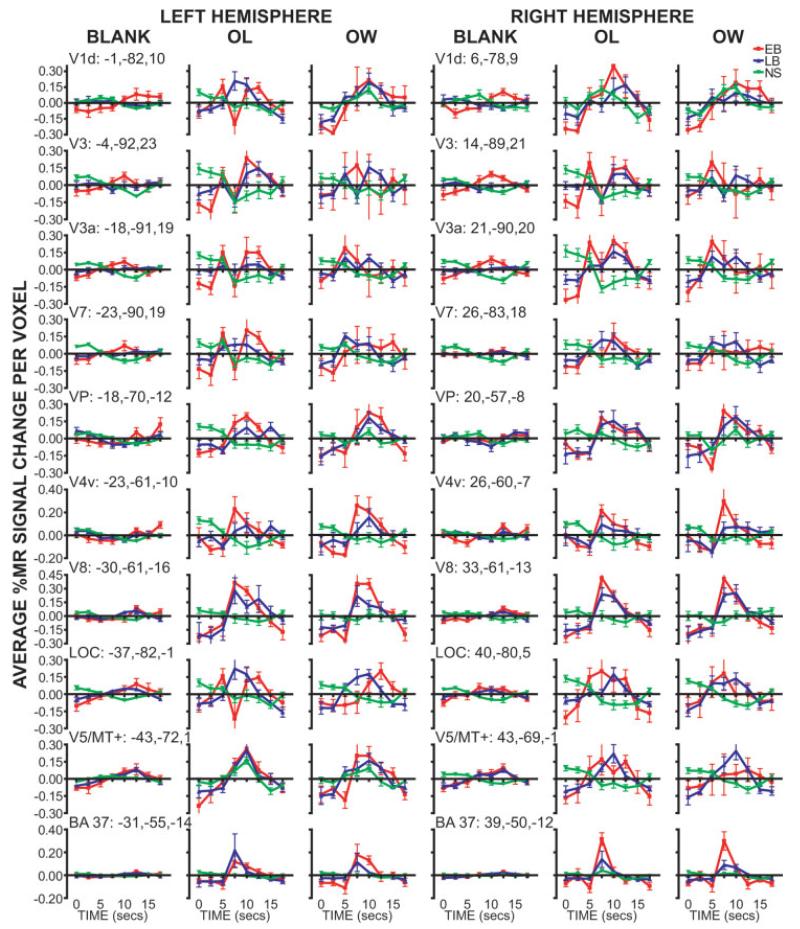
Figure 5.
Time course plots for occipito-temporal ROIs identified from the ANOVA time-by-group factor. Data at each time point shows group mean and SEM (early blind, EB; late blind, LB; and sighted, NS). Each column shows data obtained during a different task (BLANK, passive stimulation with a moving smooth surface; OL, stating the identified letter, OW, stating a verb that contains the identified letter). Atlas coordinate locations are listed for peak, based on a center-of-mass calculation, z-score of the ANOVA time-by-group factor. Abbreviations: see Figure 4.

