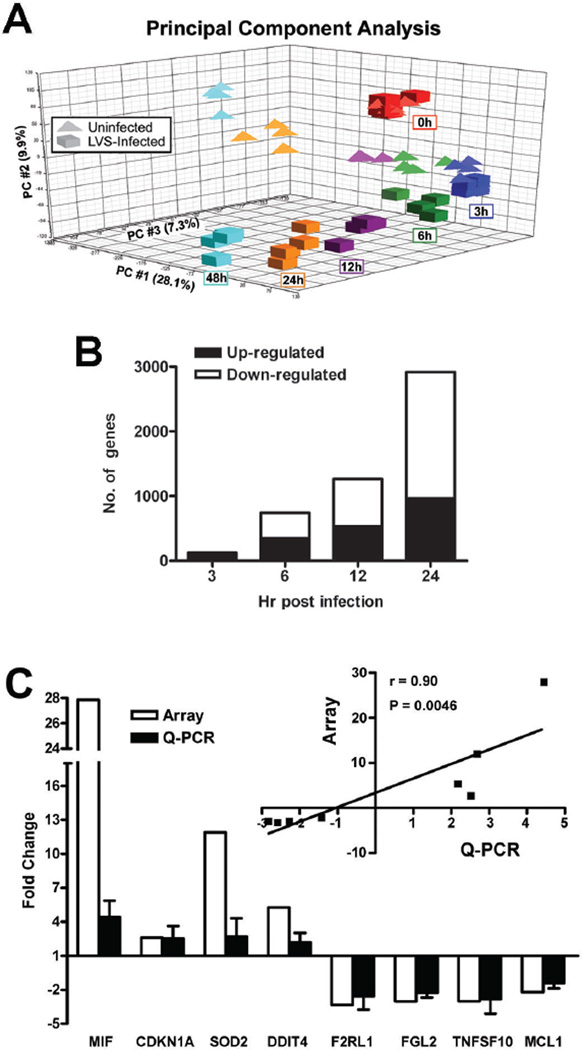
FIGURE 2.
Neutrophil gene expression is altered during F. tularensis infection. PMNs were left untreated or infected with LVS for 0–48 h and neutrophil gene expression was analyzed using Affymetrix human oligonucleotide microarrays. A, Principal component analysis (PCA) depicts variation and clusters within the data set in three dimensions. The X-axis (PC #1) indicates the largest amount of variation (28.1%), the Y-axis (PC#2) the second largest amount of variation (9.9%), and the Z-axis (PC#3) shows all of the remaining variation (7.3%), for 45.3% variation in total. B, Differentially expressed genes were categorized as up- or down-regulated and enumerated at the indicated time points. C, Confirmation of the microarray data. Differential expression of the indicated genes was quantified using real-time Q-PCR. Data shown are the mean ± SD from experiments performed using cells from three different donors. Inset, graph shows the strong correlation (Spearman correlation coefficient r =0.9136 and P = 0.0046) between the Q-PCR and microarray data.

