
Figure 1.
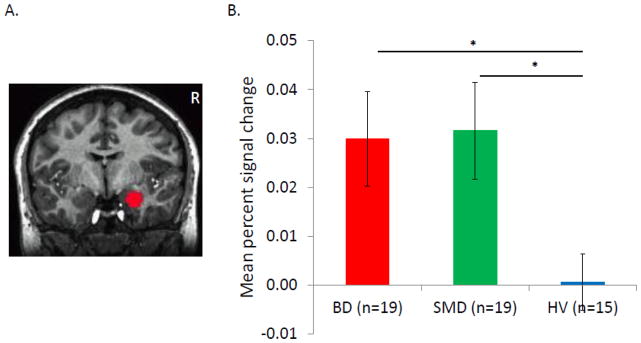

Findings of right amygdala ROI analysis
A. Right amygdala mask
B. Main effect of Diagnosis (F(2,50) = 3.39, p < .05). Mean percent signal changes across all emotion expressions in right amygdala. The error bars represent the standard error of the Mean percent signal changes. *p <.05
C. Activation of right amygdala for each expression vs. fixation. BD showed greater activation than HV in fearful expressions (t(32) = 2.52, p < .05) and in angry and neutral expressions at a trend level (ts(32) > 1.76, ps < .10). SMD showed greater activation than HV in fearful expressions (t(32) = 3.02, p < .01) and in neutral expressions at a trend level (t(32) = 2.00, p < .10). †p< .10, *p<.05, **p<.01