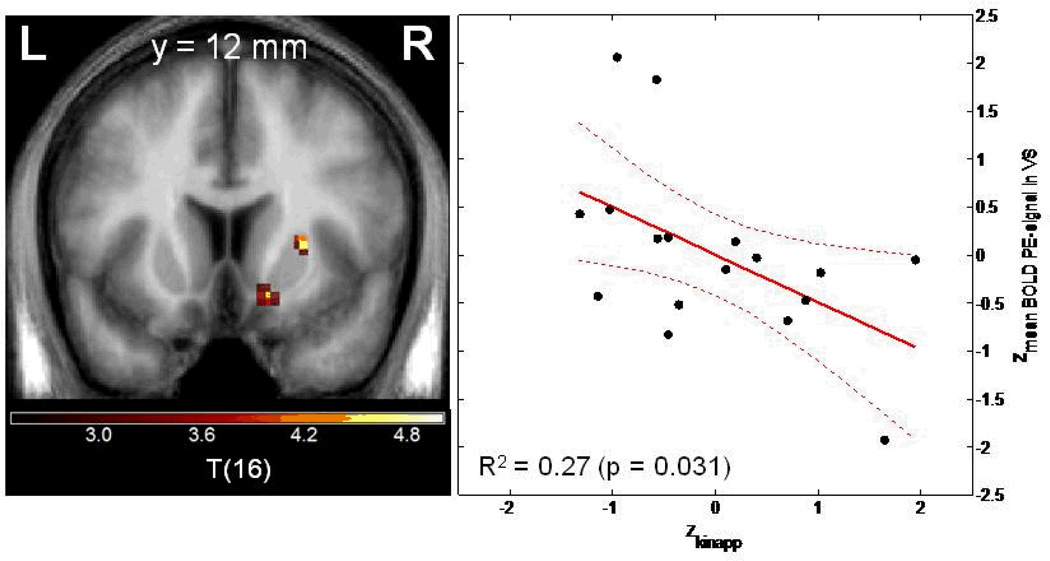
Figure 3. Negative correlation between dopamine synthesis capacity as assessed in vivo with FDOPA PET and the BOLD prediction error signal in the ventral striatum.
Left panel: Voxel-by-voxel association between FDOPA Kinapp and BOLD prediction error signal from the Biological Parametric Mapping analysis. Coronal slice at MNI coordinate y=12, statistical threshold t>3.0, minimum cluster size =20 voxels). Right panel: Plot of z-standardized mean Kinapp value derived from the right VS VOI and mean BOLD prediction error signal derived from the right ventral striatal VOI.

