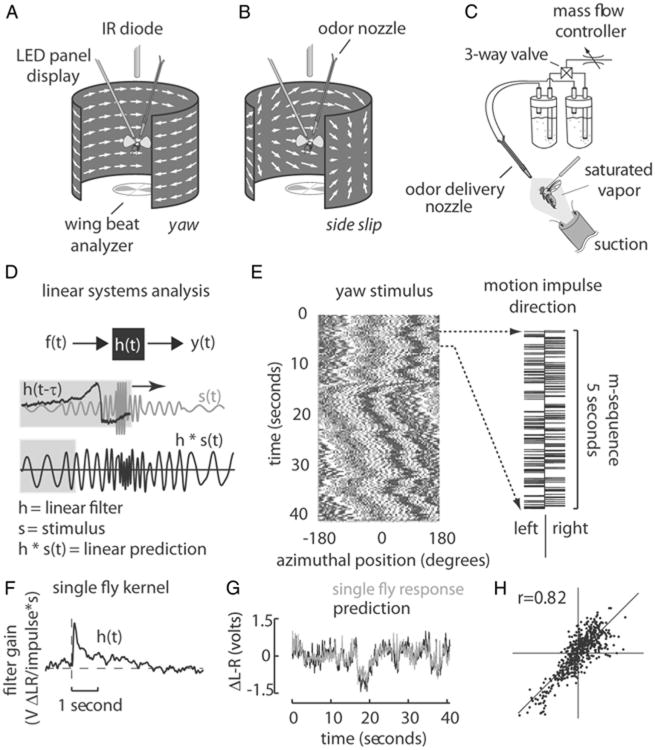
Figure 1.
Experimental apparatus, stimulus, and analysis procedure. A, B, An electronic visual flight simulator displays either wide-field yaw motion (A) or sideward translational motion (B) to a tethered fly. C, An odor nozzle was positioned in the headspace of the animal during the beginning of each experiment, allowing the delivery of either water vapor or apple cider vinegar. D, Cross-correlating the fly's behavior y(t) with the white noise stimulus f(t) produces a linear filter h(t) that describes the temporal dynamics of the fly's response to a single motion impulse (top panel). Convolving h(t) with any arbitrary stimulus s(t) produces a prediction of the fly's response to that stimulus. We therefore were able to quickly and robustly measure the optomotor phenotype of each strain through correlation with a pseudo-white noise sequence. E, The space–time plot (left) maps the angular displacements of a single row of pixels due to the cumulative motion impulses of the m-sequence (right). F,G, The resultant impulse response may be convolved with the visual motion stimulus (F) to predict the fly's behavior (G). H, By plotting the prediction against the actual data, we may estimate the amount of nonlinearity present in the fly's response (see Materials and Methods for more detail).

