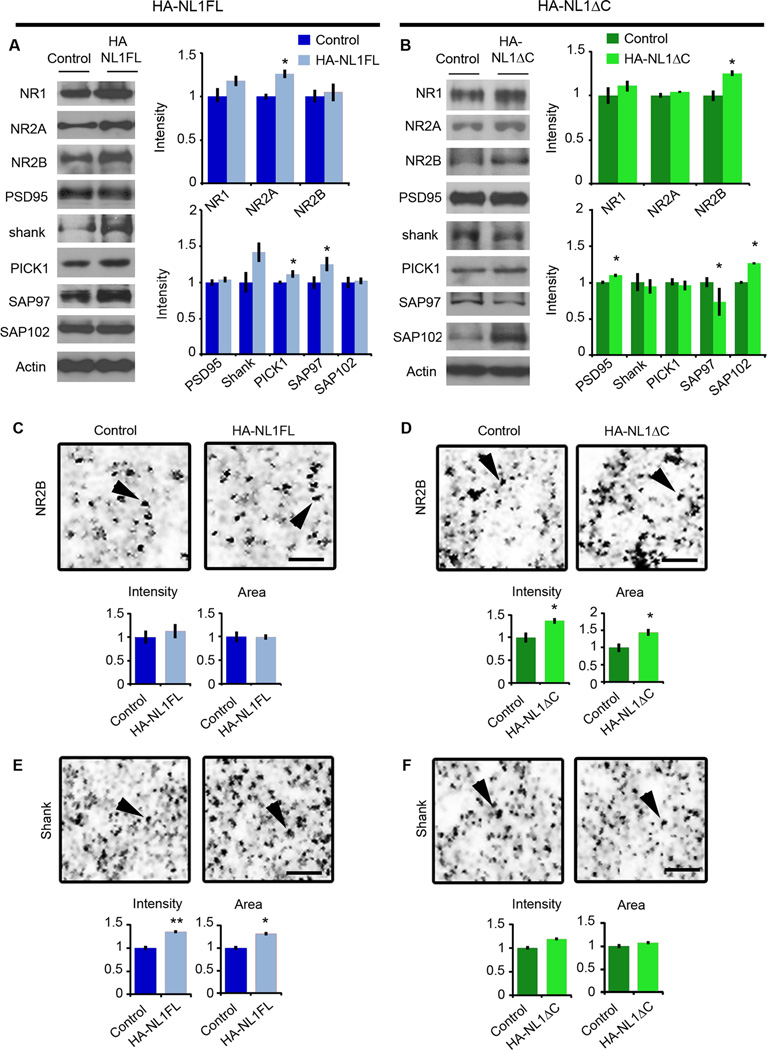
Figure 3. Distinct changes in synaptic protein composition in HA-NL1FL versus HA-NL1ΔC mice.
Representative western blots of synaptosomal fractions from the hippocampus of (A) controls vs. HA-NL1FL mice and (B) controls vs. HA-NL1ΔC mice. Lanes are aligned to show the same mouse from each group, with the mean intensity from 4 individuals plotted on the right normalized to control levels. A subset of the total blots performed showing the significant differences are shown here, detailed statistics and additional blot shown in Table 1 and 2. Representative images of a 36µm2 region of SLM from sectioned tissue immunolabeled for NR2B from (C) controls vs. HA-NL1FL mice and (D) controls vs. HA-NL1ΔC mice. Average intensity and area of puncta from the 4 individuals from each group is graphed below. Scale bar equals 2 µm, and arrows highlight puncta for comparison. Representative images of a region of SLM labeled for panShank from (E) controls vs. HA-NL1FL mice and (F) controls vs. HA-NL1ΔC mice. Scale bar equals 2 µm, and arrows highlight puncta for comparison. Significance was determined with Student’s t-test, all data are shown mean ± SEM, * = p < 0.05, ** = p < 0.01, n = 4 pairs (4 mice in each group).

