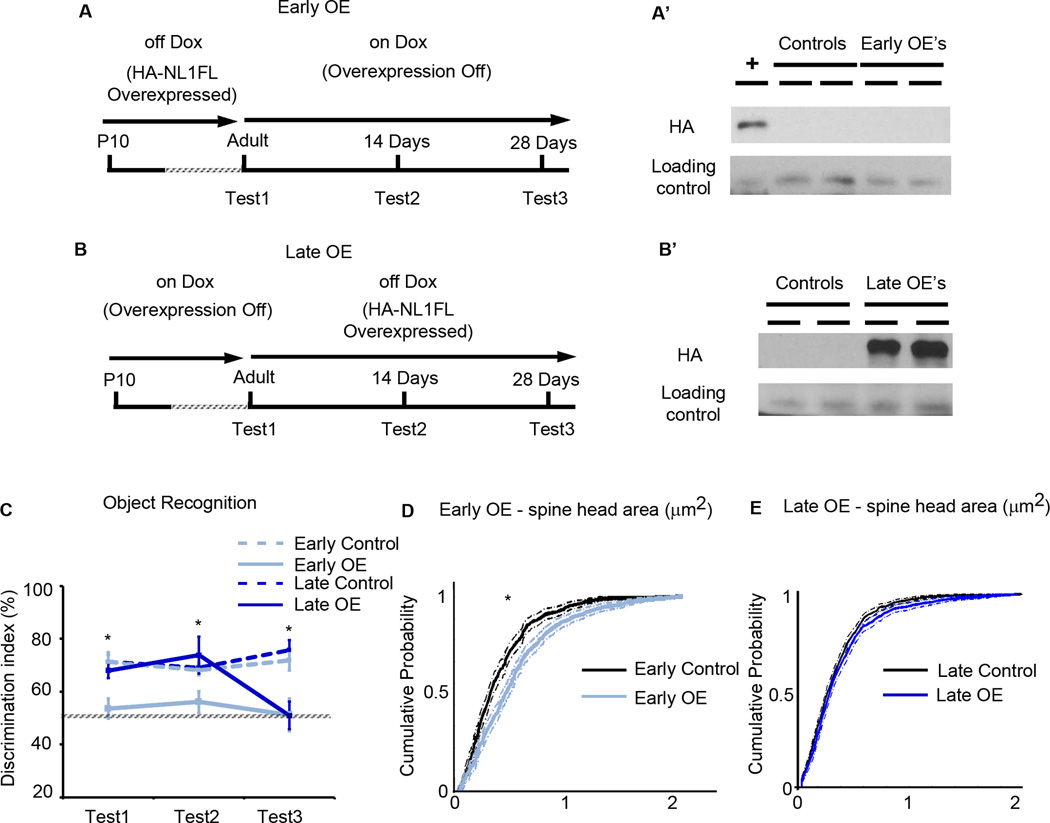
Figure 8. Overexpression of NL1FL is not required to maintain changes in synaptic maturation nor behavior, and can initiate behavioral changes in the adult.
(A) Summary of the experimental procedure to induce overexpression of HA-NL1FL only during development in adolescence, the “Early OE’s.” Behavioral testing occurred first at the time when HA-NL1FL was still overexpressed (Test1), then two weeks after transgene expression was inhibited (Test2), and then again after four weeks of transgene inhibition (Test3). (A’) Western blots performed on forebrain homogenate of mice upon completion of behavioral testing to assess presence of transgene, + is cell lysate with HA-NL1FL present to confirm HA immunolabeling. (B) Summary of the experimental procedure to induce HA-NL1FL overexpression only in the adult, leaving critical developmental periods unperturbed, the “Late OE’s.” Initial behavior testing in these animal started just before HA-NL1 overexpression was induced in the Late OE’s, (Test1), two weeks after transgene expression induction (Test2) and four weeks after induction (Test3). (B’) Western blot confirmation of HA-NL1FL overexpression in late OE’s. All experimental groups were compared to co-housed single positive littermates simultaneously on the same Dox diet regime. (C) Performance in the object recognition task as measured by the novel object discrimination index (%) at the designated testing periods. Transgenic performances are shown in light and dark solid lines and control performances are depicted by light and dark dashed lines. All data shown are mean ± SEM, and significance determined by repeated measures ANOVA. (D) Cumulative distributions with associated confidence intervals for spine head size of the synaptic population within the SLM from the Early OE’s (light blue) and their controls (black), *p <0.05, Kolmogrov-Smirnov test. (E) Cumulative distributions with associated confidence intervals for spine head size in the Late OE’s (dark blue) and their controls (black), p > 0.05, Kolmogrov-Smirnov test, n ≥ 36 dendritic spine segments from 3–4 animals in each group.

